Can I work with daily averages?
One of the major consideration of my Chapter 2 (loading/no-loading) experiment is whether I can halve model run time by writing daily average model output instead of hourly output.
This week, I artificially created daily average values and compared TEF fluxes into terminal inlets using the hourly data and the artificial daily average data.
Although the general seasonal profiles are similar, there is still some variability between the hourly and daily average data.
More details below.
Hourly and Daily Average Comparison
For this comparison, I used data from the model run I analyzed in my Master’s thesis (cas7_t0_x4b). I already had the TEF fluxes calculated from the hourly model output.
I adjusted the tef2 code to artificially create and process daily averages. I began interfering in the code after the extract_sections step. The extract_sections script extracts the hourly state variables (e.g. velocity, DO) at the mouth of every inlet. I took these hourly state variables and calculated daily averages in time (shortening the time dimension from 8760 hours in a year to 365 days). This was an Eulerian operation because I calculated these daily averages at a fixed location in space.
Then, I pushed these artificial daily averages through the rest of the tef2 processing code. The only other change I made was to remove the lowpass Godin filter (since daily averages are already a type of lowpass filter!).
Generally, the seasonal profiles of the hourly and daily-averaged fluxes are quite similar. Figure 1 shows an example comparison at the mouth of Carr Inlet, which has particulalry similar flux timeseries.
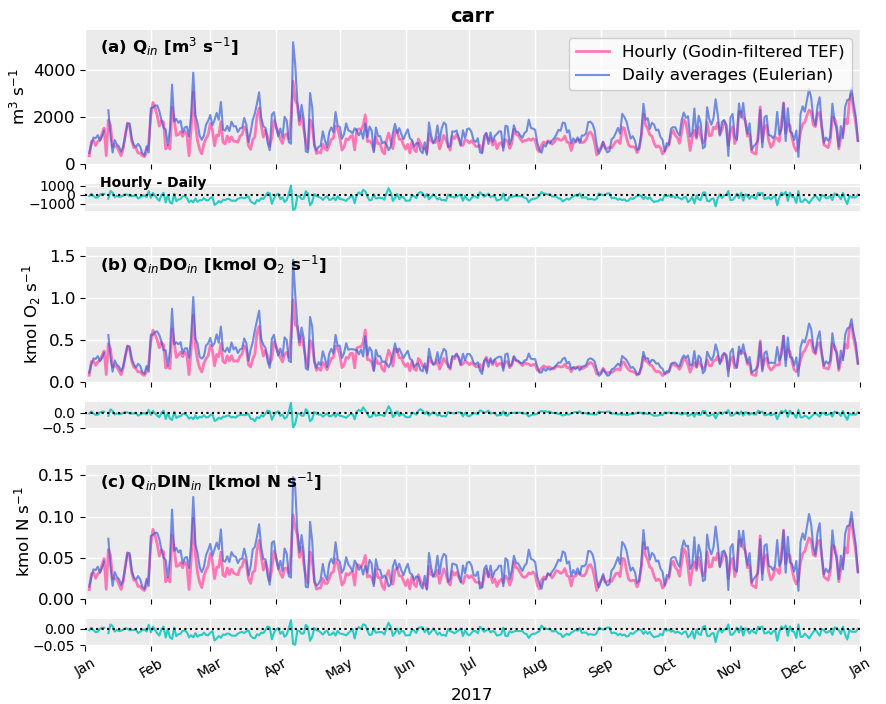
Fig 1. Comparison of hourly TEF and daily-averaged fluxes through Carr Inlet. Panel (a) compares Qin. Panel (b) compares QinDOin. Panel (c) compares QinDINin. Under every panel is a timeseries of the hourly minus the daily time series.
However, the daily-averages sometimes overestimated the inflowing fluxes relative to the hourly TEF values. An example is Penn Cove (Figure 2).
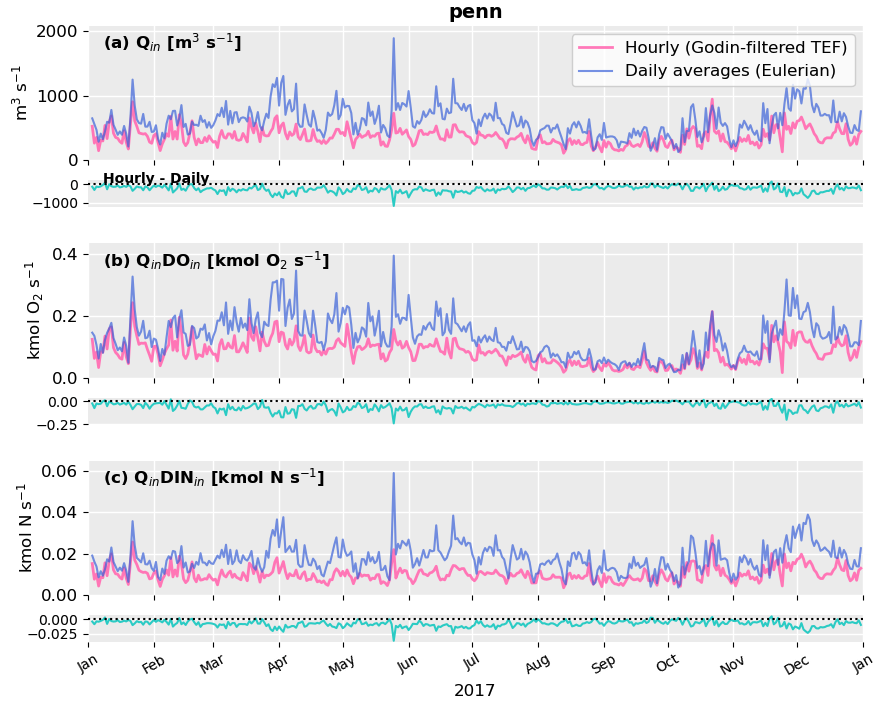
Fig 2. Comparison of hourly TEF and daily-averaged fluxes through Penn Cove. Panel (a) compares Qin. Panel (b) compares QinDOin. Panel (c) compares QinDINin. Under every panel is a timeseries of the hourly minus the daily time series.
Dyes Inlet is the only inlet that is giving me particular trouble. It almost appears as though something in the processing scripts is clipping the daily-average data (Figure 3).
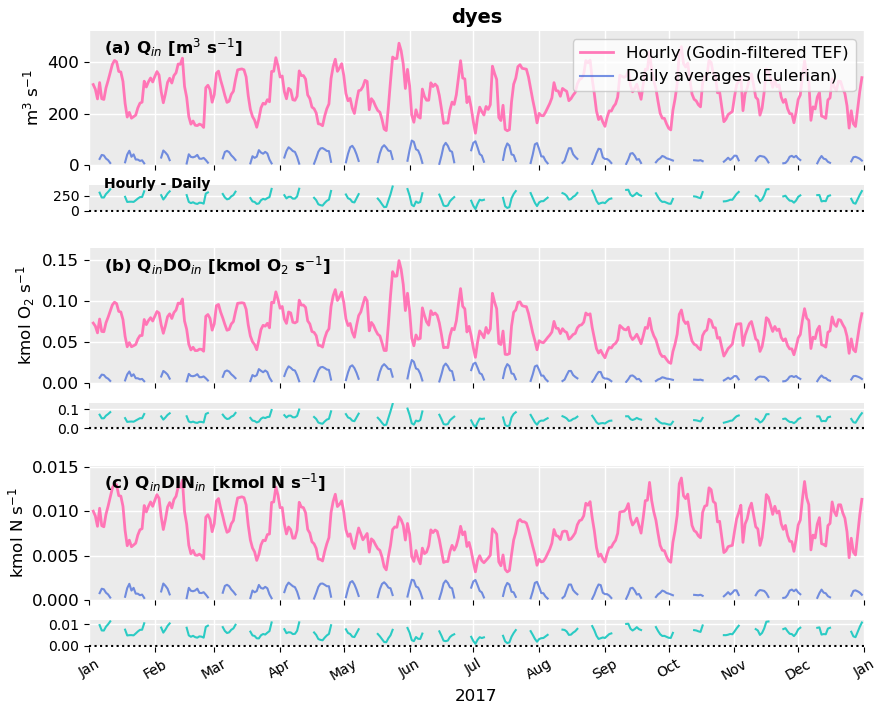
Fig 3. Comparison of hourly TEF and daily-averaged fluxes through Dyes Inlet. Panel (a) compares Qin. Panel (b) compares QinDOin. Panel (c) compares QinDINin. Under every panel is a timeseries of the hourly minus the daily time series.
Remaining to-dos before beginning run
I had a few more email exchanges with Jilian and learned that the current cas7_t0_x9b run with the latest biogeochemistry does not have stronger nudging to climatology for the biogeochemistry variables. This means that I can expect to see bit-reproducibility noise between the loading and no-loading runs if I use her run as my baseline “loading” condition. Additionally, she mentioned that she changed the number of nodes she was using throughout the run. Therefore, I might also expect to see some bit-reproducibility issues in the hydrodynamics as well.
Therefore, I propose re-running both a loading and a no-loading run for my Chapter 2 experiment.
If we think that we can get away with daily-averages, then that will save some time. Otherwise, I have come up with a schedule where we output hourly data for the “loading” run, and output daily-averages for the “no-loading” run. See the “Timeline for Chapter 2” section below.
The other remaining considerations I need to think about for this experiment include:
- Coordinate computing resource allocation with team
- Set up and double-check WWTP loading
- For the sake of time, I plan to stick with the older version of the Ecology loading data that is already integrated in LiveOcean
- Set up and run some tests using stronger nudging to climatology for the biogeochemistry variables
- Set up and run tests using daily-average model output
- Get an “okay” from King County for my experimental conditions (see subsection below)
Experimental condition
The main question I want to answer with this experiment is: “How much do nutrients from WWTP outfalls contribute to hypoxia in Puget Sound?”
To answer this question, the most logical experiment to run (in my mind) is:
- Anthropogenic, or “Loading” run, in which WWTPs discharge present day nutrient loads
- Natural, or “No-Loading” run, in which WWTPs discharge no nutrients
I plan to keep hydrodynamics the same in both runs. So comparing these two simulations will tell us what is different in Puget Sound as a result of just nutrients in WWTP discharge– which is what I am interested in understanding.
Mike was interested in discussing experimental design, so I’ll keep him in the loop with my plans. I’ll also send this experimental plan to King County before launching any simulations.
Timeline for Chapter 2
Below is my proposed timeline for Chapter 2. I plan to run the model from 2013 - 2017.
- April 17 - May 1 (Two weeks)
- Prepare model run. Set up tests to compare daily average output and hourly output. Test stronger nudging to climatology. Get WWTP forcing ready for runs- review the WWTP climatologies and clean anything up if needed
- May 1 - June 5 (Five weeks)
- Run “no-loading” runs. The “no-loading” run will output daily averages. While these are running, submit Paper 1 and wrap up anything else related to Chapter 1.
- May 1 - July 10 (Ten weeks)
- Run “loading” run with hourly output averages
- June 5 - July 10 (Five weeks)
- Prepare analysis scripts to compare nutrient and DO fluxes, and nutrient and DO concentrations in “loading” and “no-loading” runs. For the time being, simply use Jilian’s cas7_t0_x9b run as my “loading” conditions– where results are subject to change once my hourly baseline run is complete.
- July 10 - July 31 (Three weeks)
- Re-analyze data with both completed simulations. Conduct additional investigation as needed
- July 31 - August 31 (Four weeks)
- Draft paper