Integrating new WWTP data
This week I focused on integrating the new Ecology/USGS point source data into LiveOcean.
As it turns out, the new data is a tougher beast to tame than I anticipated. There is still quite a lot of work to be done. However, I managed to identify several idiosyncrasies that warrant some discussion. I have highlighted the most important discoveries below.
Data overview
The new Ecology/USGS point source data were developed as input data for a SPARROW watershed model.
The point source data include 47 fish hatcheries, 20 industrial facilities, and 97 WWTPs across US Salish Sea waters. The old dataset only had 10 industrial facilities and 87 WWTPs.
For each of these facilities, the dataset provides nutrient loading estimates at a monthly temporal resolution from 2005 to 2020, inclusive. These data are primarily derived from reports generated by the facilities. Multiple linear regression models were used to estimate loads when there were lapses in the data.
Rationale for using new data
The new data provide more accurate estimates of WWTP loads through 2020, whereas the old dataset ended in mid-2017. Thus, we could use loading data for individual years for the full duration of my “loading / no-loading” experiment.
Figure 1 shows an example comparison of the old data, new data, and climatologies (based on old data) for the West Point WWTP.
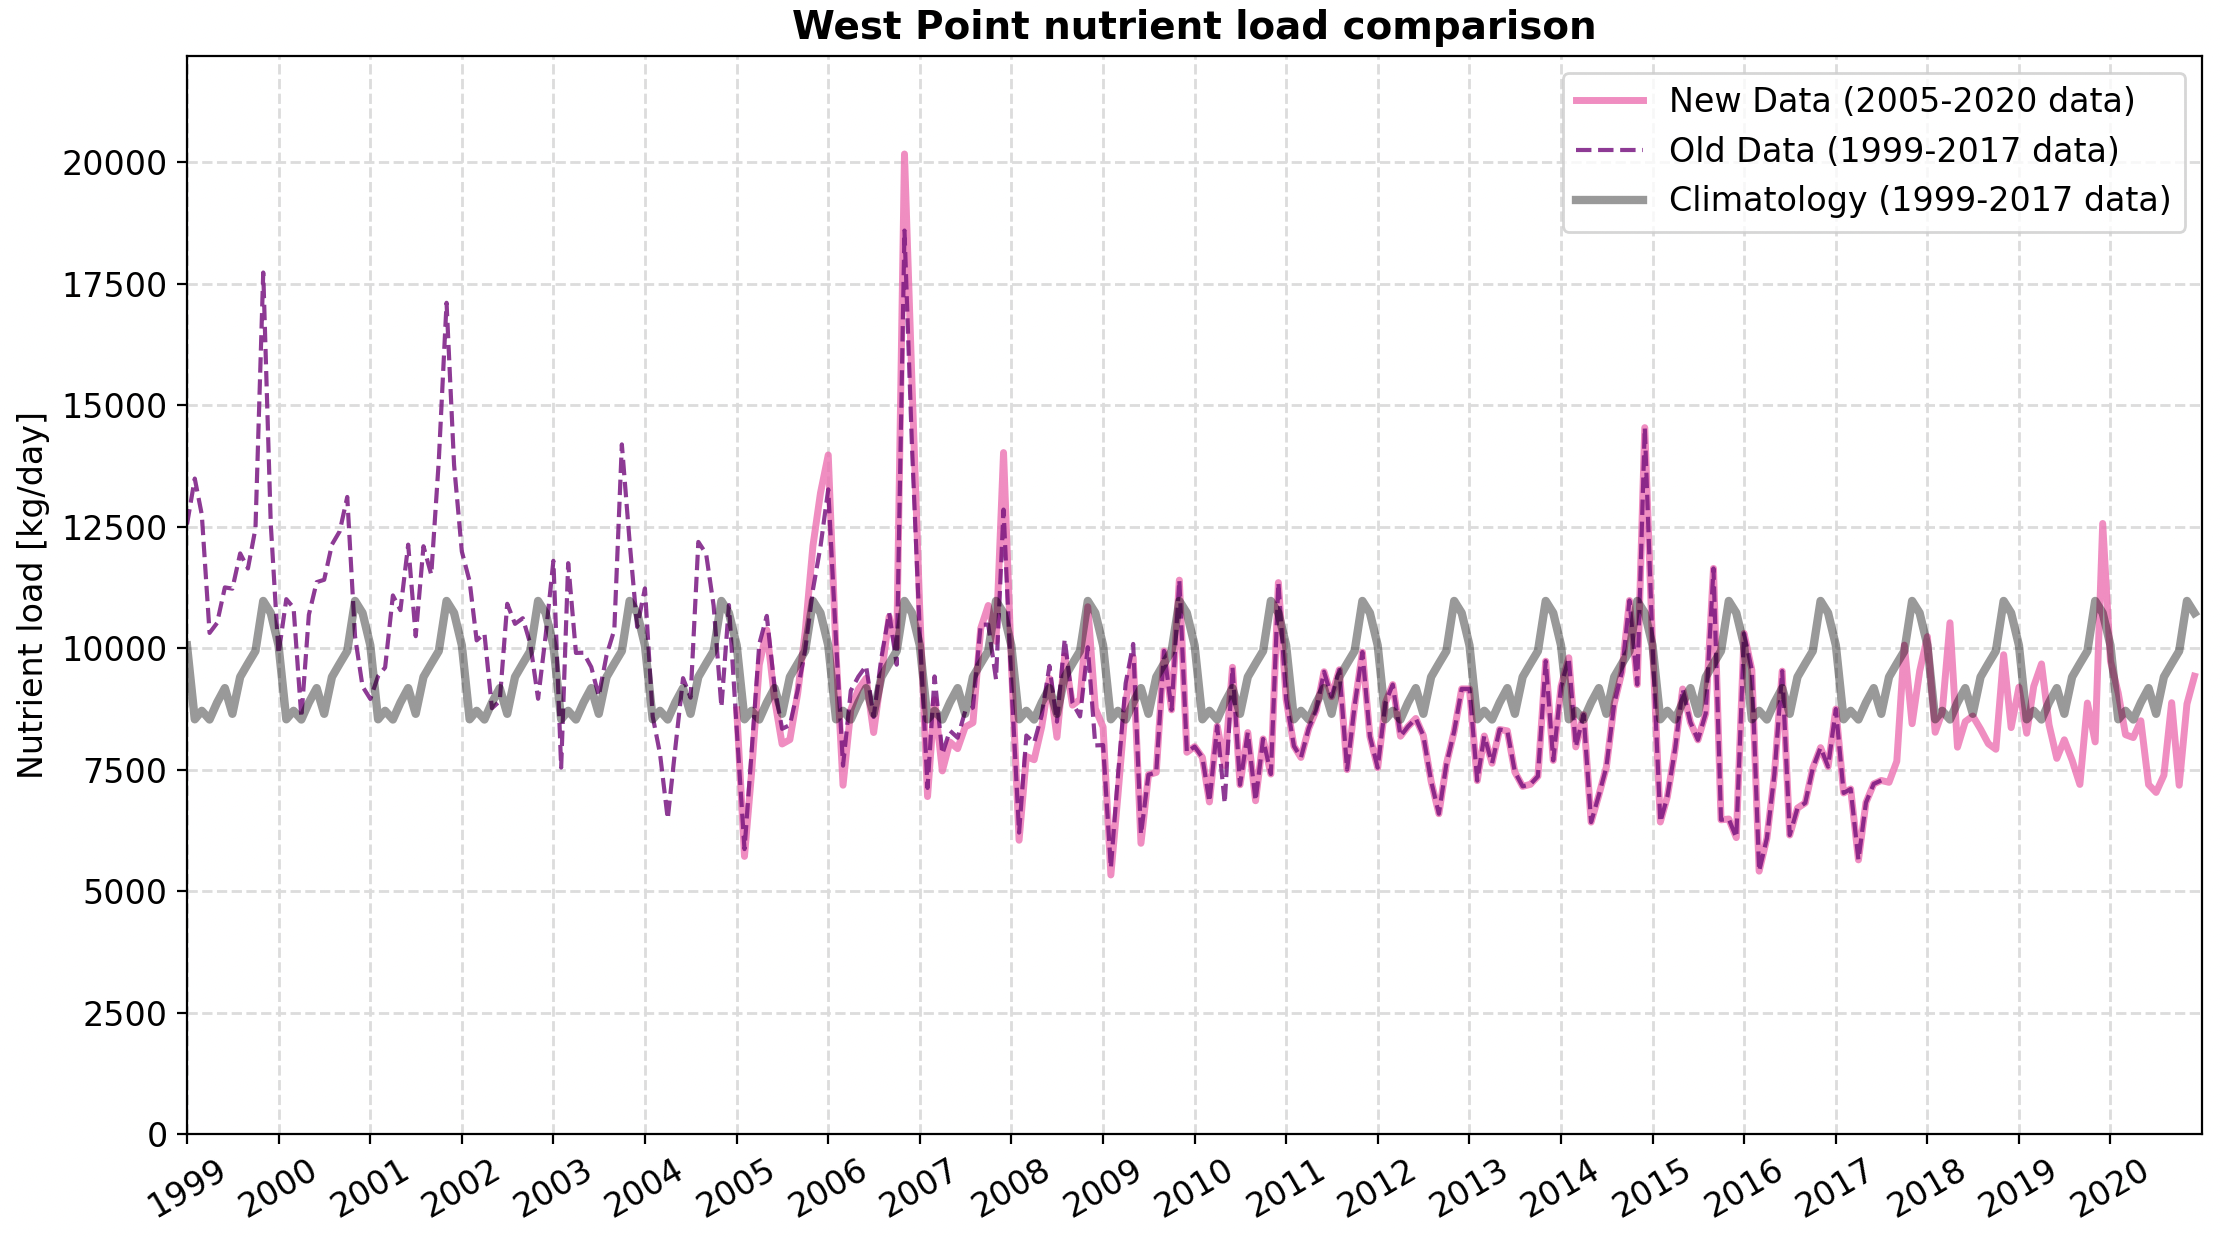
Fig 1. Time series comparison of West Point nutrients loads.
Decision to omit hatchery and industrial facility data
One issue I had with the new data was that only WWTPs had consistent flow and nutrient data. Some of the industrial facilities, and all of the fish hatcheries, had only nutrient loads (after flow and nutrient concentrations are already multiplied together). Therefore, I cannot accurately add these hatchery and industrial facility data to LiveOcean without guessing the flow and nutrient concentrations. Thus, I have decided to omit all fish hatchery and industrial facility data.
The older Ecology dataset included flow and nutrient data for all 10 of its industrial facilities. But the older dataset only accounts for a fraction of the industrial facilities included in the new dataset.
Though it is feasible to use the older dataset for some industrial facilities, I feel that mixing two datasets might lead to confusion for future model users. Additionally, nutrient permits only apply to WWTPs and not to industrial facilities. If I included industrial facilities in the model, I would need to create a special case to treat WWTPs and industrial facilities differently when I set nutrient loads to zero in my “no-loading” run. Therefore, it seems justifiable to omit industrial facility data from the model inputs.
WWTP locations
Now with only WWTPs remaining in the dataset, I stumbled upon a different set of issues:
- The new dataset only includes WWTPs located in US waters. Canadian WWTPs are unaccounted for
- Many WWTPs in the new dataset are located very far upstream, and do not discharge directly into Puget Sound.
Figure 2 shows a maps comparing the locations of facilities in the old and new datasets.
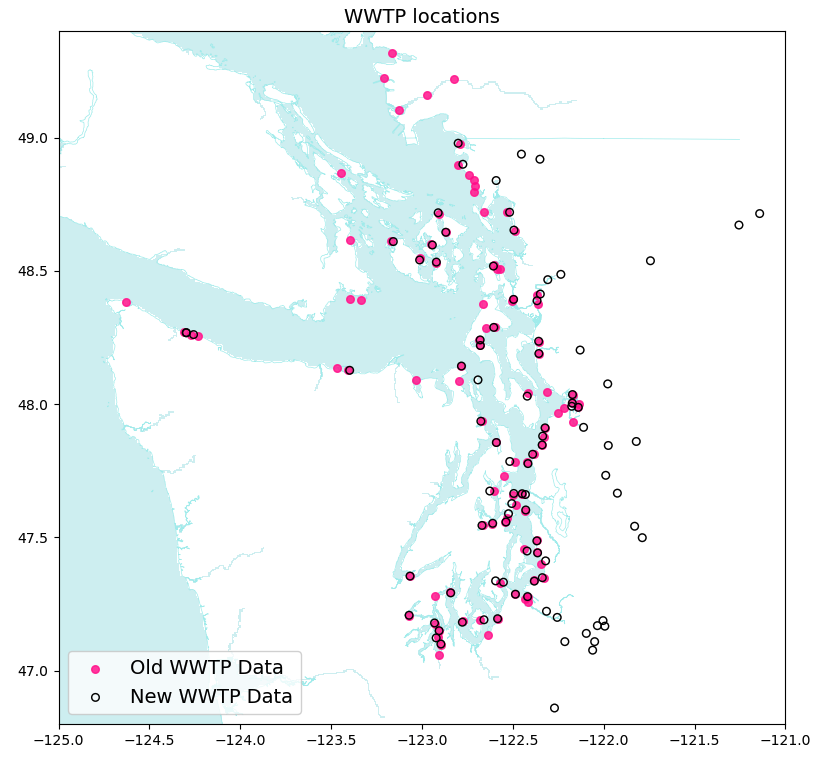
Fig 2. Locations of WWTPs in the old and new point source datasets.
I have an idea for a workaround, but it requires a bit of effort and some dataset mixing, which could become difficult to manage and document properly down the line:
- Use WWTP data from the old dataset. If the new dataset contains updates for a particular WWTP, then use the new data instead. Otherwise, stick with old climatologies
- The challenge with this method is that I will need to manually go through and identify which WWTPs are the same in both the old and new datasets. The naming convention is different, so I cannot automate this process.
I’m interested in hearing more thoughts and ideas on this topic.
Other state variables
Lastly, I discovered that the new dataset only includes flow and nutrient concentrations for the WWTPs. Temperatue, DO, total alkalinity, and TIC are not included in the new dataset. But, they are required inputs to LiveOcean.
Therefore, I plan to use values from the old dataset for these state variables. Note that in the old dataset, every single WWTP and industrial facility had identical temperature, DO, total alkalinity, and TIC profiles. In fact, temp, DO, and alkalinity were all the same constant value for all plants and for all years (Figure 3). Only TIC varied by year, though the profile was still the same across all plants. Thus, it seems that these state variables were not well-resolved in the old dataset, and entirely omitted from the new dataset.
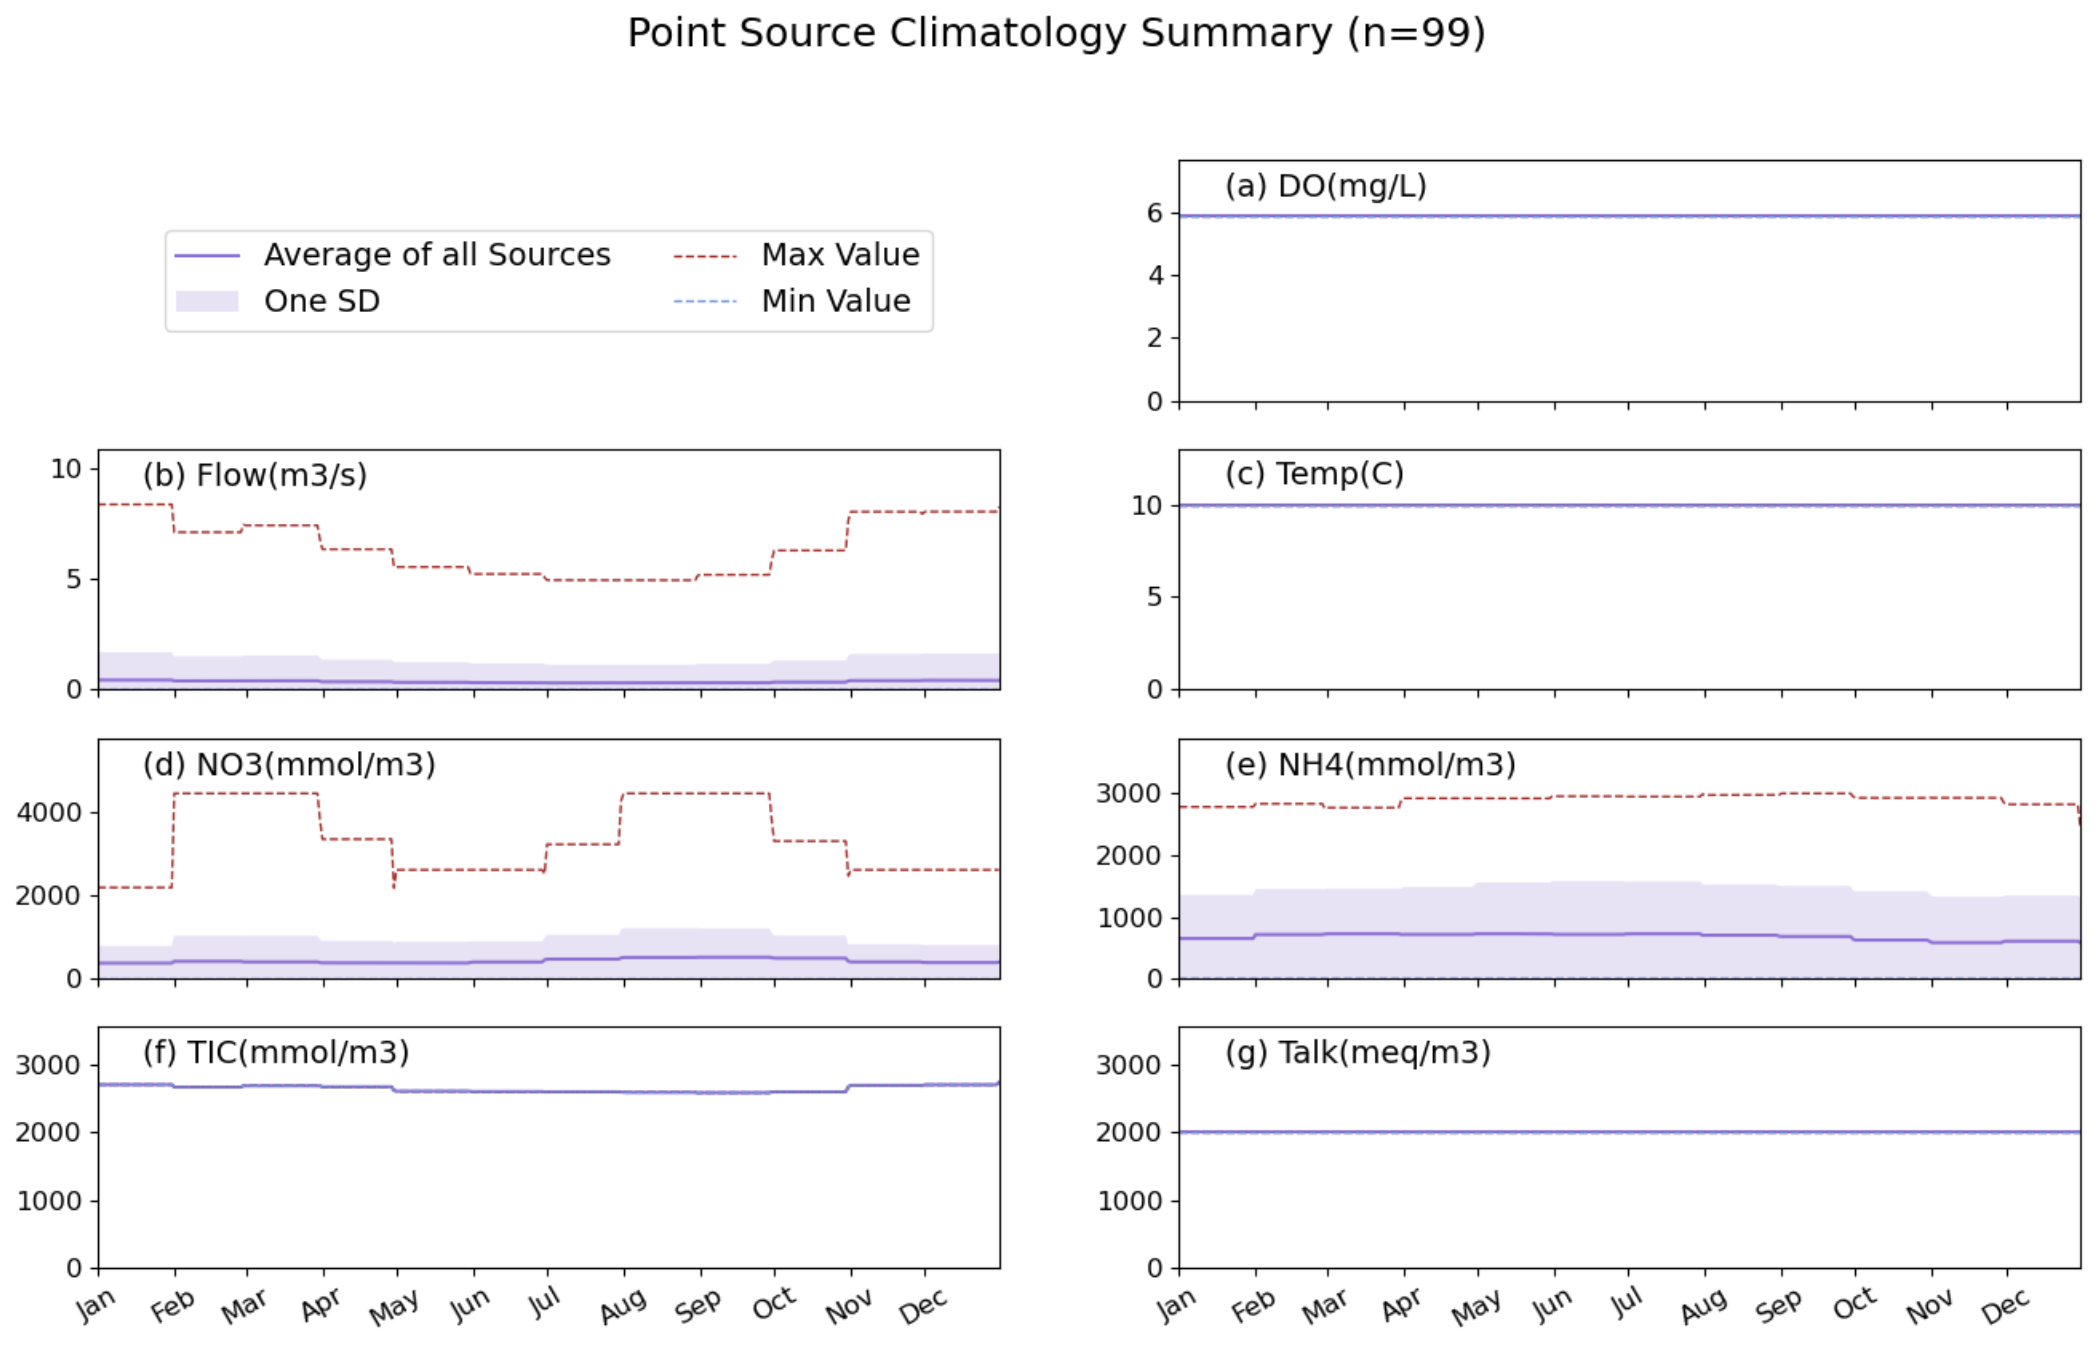
Fig 3. Point source climatologies used in current version of LiveOcean.