WWTP Data Deep Dive
This week I continued exploring the WWTP datasets. My primary focus was to understand the relative contribution of nutrient loads between different types of facilities and between the two datasets. This work informs how we incorporate and combine the new and old WWTP datasets.
Naming Convention
Throughout this blog post, I will refer to the datasets as:
- Mohamedali et al. (2020)
- Moh20 for short
- Older Ecology dataset currently used for LiveOcean climatologies
- 1999 through mid-2017
- Wasielewski et al. (2024)
- Was24 for short
- Newer Ecology/USGS dataset
- 2005 through 2020
Facility Types: WWTPs, hatcheries, and industrial facilities
Last week we made the decision to omit fish hatcheries and industrial facilities from the point source integration. This is because the Wasiewlewski et al. (2024) hatchery and industrial data contained only nutrient loads (flow*concentration), and they did not contain the individual flow and concentration fields needed for LiveOcean.
In the current version of LiveOcean, both WWTPs and industrial facilities are active because the Mohamedali et al. (2020) data had individual flow and concentration data for each source type.
Moving forward, I will omit anything that is not a WWTP from both datasets.
Figure 1 shows the locations and relative nutrient load contributions of WWTPs and industrial facilities in the Mohamedali et al. (2020) dataset. Note the log-scale y-axis in the time series panel.
Figure 2 is a similar figure, but using the Wasielewski et al. (2024) data. Note that fish hatcheries are also included in this figure.
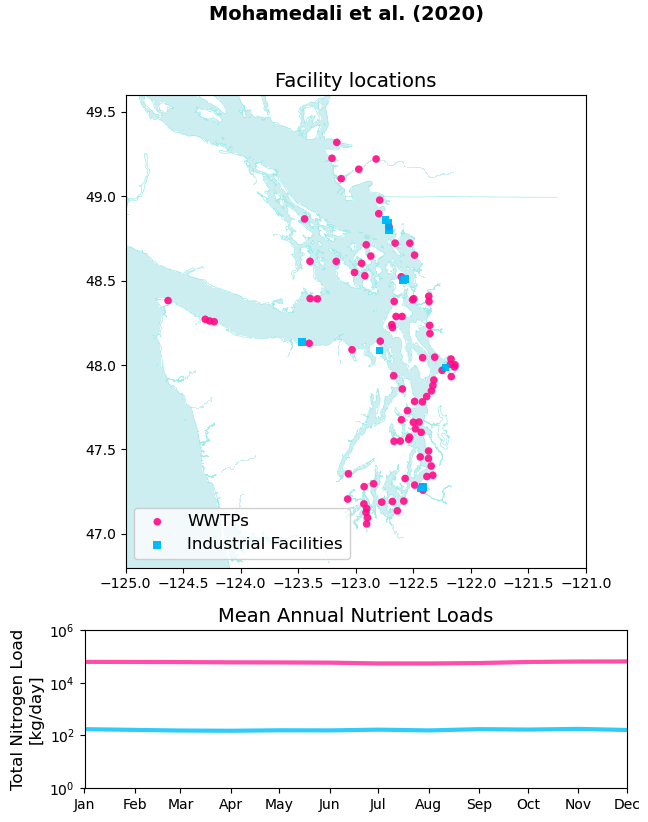
Fig 1. Top panel: locations of WWTPs and industrial facilities in the Mohamedali et al. (2020) dataset. Bottom panel: climatology nutrient load profiles for the sum of each type of facilitiy (e.g., pink is the climatology for the sum of all WWTPs).
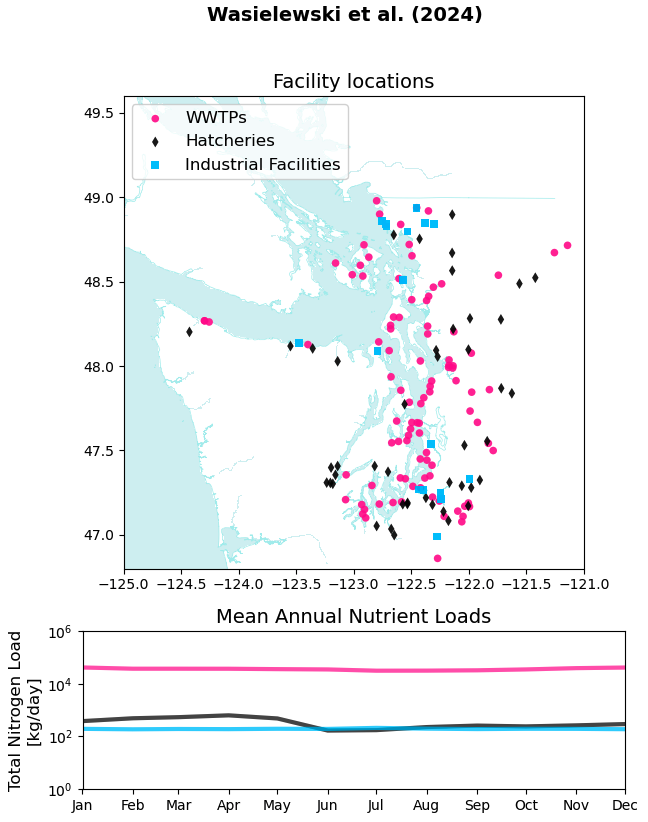
Fig 2. Top panel: locations of WWTPs, fish hatcheries, and industrial facilities in the Wasielewski et al. (2024) dataset. Bottom panel: climatology nutrient load profiles for the sum of each type of facilitiy (e.g., pink is the climatology for the sum of all WWTPs).
In both datasets, the nutrient loads from all WWTPs is more than two orders of magnitude larger than the nutrient loads from industrial facilities and from fish hatcheries. Thus, it is justifiable to omit the latter two facility types from the model.
The remaining analysis in this blog post pertains to WWTPs only.
Largest dischargers in both datasets
Last week we also discussed how the two datasets contain different WWTPs. We decided to use all WWTPs listed in the Mohamedali et al. (2020) dataset. If the Wasielewski et al. (2024) data contained the same WWTPs, then I will update the flow and nutrient concentrations using this new data. Any WWTPs provided only in the Wasielewski et al. (2024) dataset will be omitted from the model.
To verify that this is a reasonable approach, I compared the top 10 largest dischargers in the two datasets (Fig. 3).
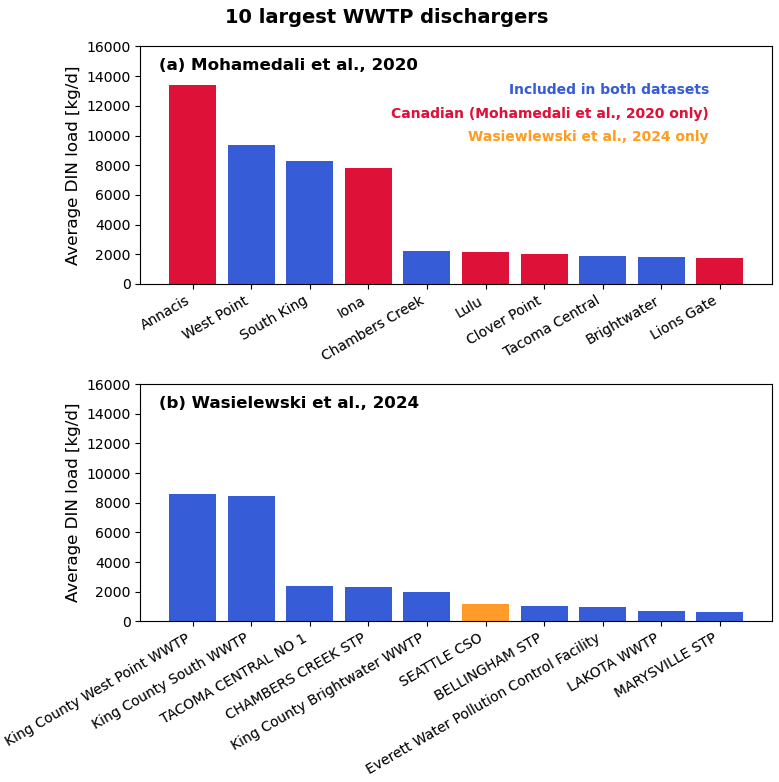
Fig 3. Top 10 largest WWTP dischargers in both datasets. Each bar represents the average nutrient load from a WWTP over the entire duration of the dataset. Blue bars indicate that the WWTP is included in both datasets. Red bars mean that the WWTP is only in Mohamedali et al. (2020). The red WWTPs in the top 10 all happen to be Canadian. Yellow bars mean that the WWTP is only in Wasielewski et al. (2024).
Many of the largest WWTPs in the Mohamedali et al. (2020) dataset are Canadian WWTPs, which are not included in the Wasielewski et al. (2024) dataset. Therefore, we can justify keeping all of the WWTPs that are in the Mohamedali et al. (2020) data.
Nine of the top 10 WWTPs in the Wasielewski et al. (2024) data are also in the Mohamedali et al. (2020) data (good!). The only “top 10”-WWTP that would be omitted is Seattle CSO. Although this is a large discharger, the Nutrient General Permit does not cover this CSO. Thus, it seems reasonable to omit this point source from the WWTP loading experiment. (Also, the massive load from Seattle CSO appears to come from just a handful of huge storm events prior to 2012– figure not shown)
Visualizing the loads included and the loads omitted
Lastly, I quantified all the different ways we can partition the WWTP nutrient loads in the two datasets.
Figure 4 shows a map of the WWTPs in both datasets. If a WWTP is present in both datasets (blue), I plotted its location using the lat/lon coordinates listed in Mohamedali et al. (2020). The WWTPs in Wasielewski et al. (2024) but not in Mohamedali et al. (2020) are primarily upstream of Puget Sound marine waters.
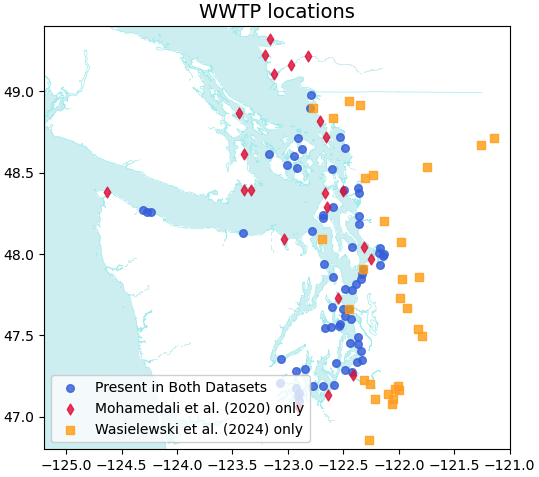
Fig 4. WWTP locations. Blue means that the WWTP is present in both datasets, and the lat/lon info comes from Mohamedali et al. (2020). Red means the WWTP is only in Mohamedali et al. (2020). Yellow means the WWTP is only in Wasielewski et al. (2024).
Figure 5 shows time series of the different groups of nutrient loads. These profiles are climatologies of the sum of all WWTPs that belong to a group. The groups are:
- [A] All WWTPs in Mohamedali et al. (2020)– what is currently used in LiveOcean
- sum of [B] + [C]
- [B] WWTPs that are ONLY in Mohamedali et al. (2020)
- [C] WWTPs that are in both datasets, but plotted using data from Mohamedali et al. (2020)
- [D] WWTPs that are in both datasets, but plotted using data from Wasielewski et al. (2024)
- [E] WWTPs that are ONLY in Wasielewski et al. (2024)
- [F] All WWTPs in Wasielewski et al. (2024)
- sum of [D] + [E]
- [G] Proposed nutrient loads for modeling experiment
- sum of [B] + [D]
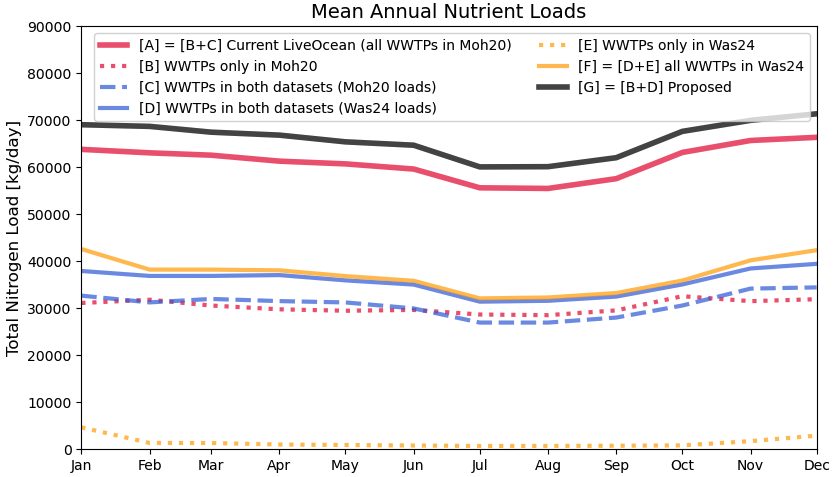
Fig 5. Nutrient loading climatologies for the sum of all WWTPs belonging to a specific group.
In the proposed experiment, we are only omitting the dashed yellow line [E], which comprises a very small amount of nutrient loads compared to the other groups of dischargers.
What’s next?
I have been careful about my directory and file naming convention and organization to prepare for a clean WWTP integration into LiveOcean. Hopefully this actual integration process should be straigtforward from here on out.
Some final questions that I’m still mulling over:
Climatologies
For the Wasielewski et al. (2024) data, I will switch from yearly data to climatologies following 2024.
Something I am thinking about is whether to also use yearly data from the Mohamedali et al. (2020) data. This dataset ends mid-way through 2017. I am leaning towards only using climatologies for this dataset so that my “yearly data / climatology data” usage is consistent throughout the entire 2014 - 2017 experiment period.
Lastly, I need to decide how to calculate climatologies for all WWTPs. Several WWTPs have variable loads of the dataset period (e.g. Tacoma Central No 1; Fig 6). I would like to spend time going through the WWTPs to decide the appropriate climatology-averaging period, particularly for the larger dischargers like Tacoma Central.
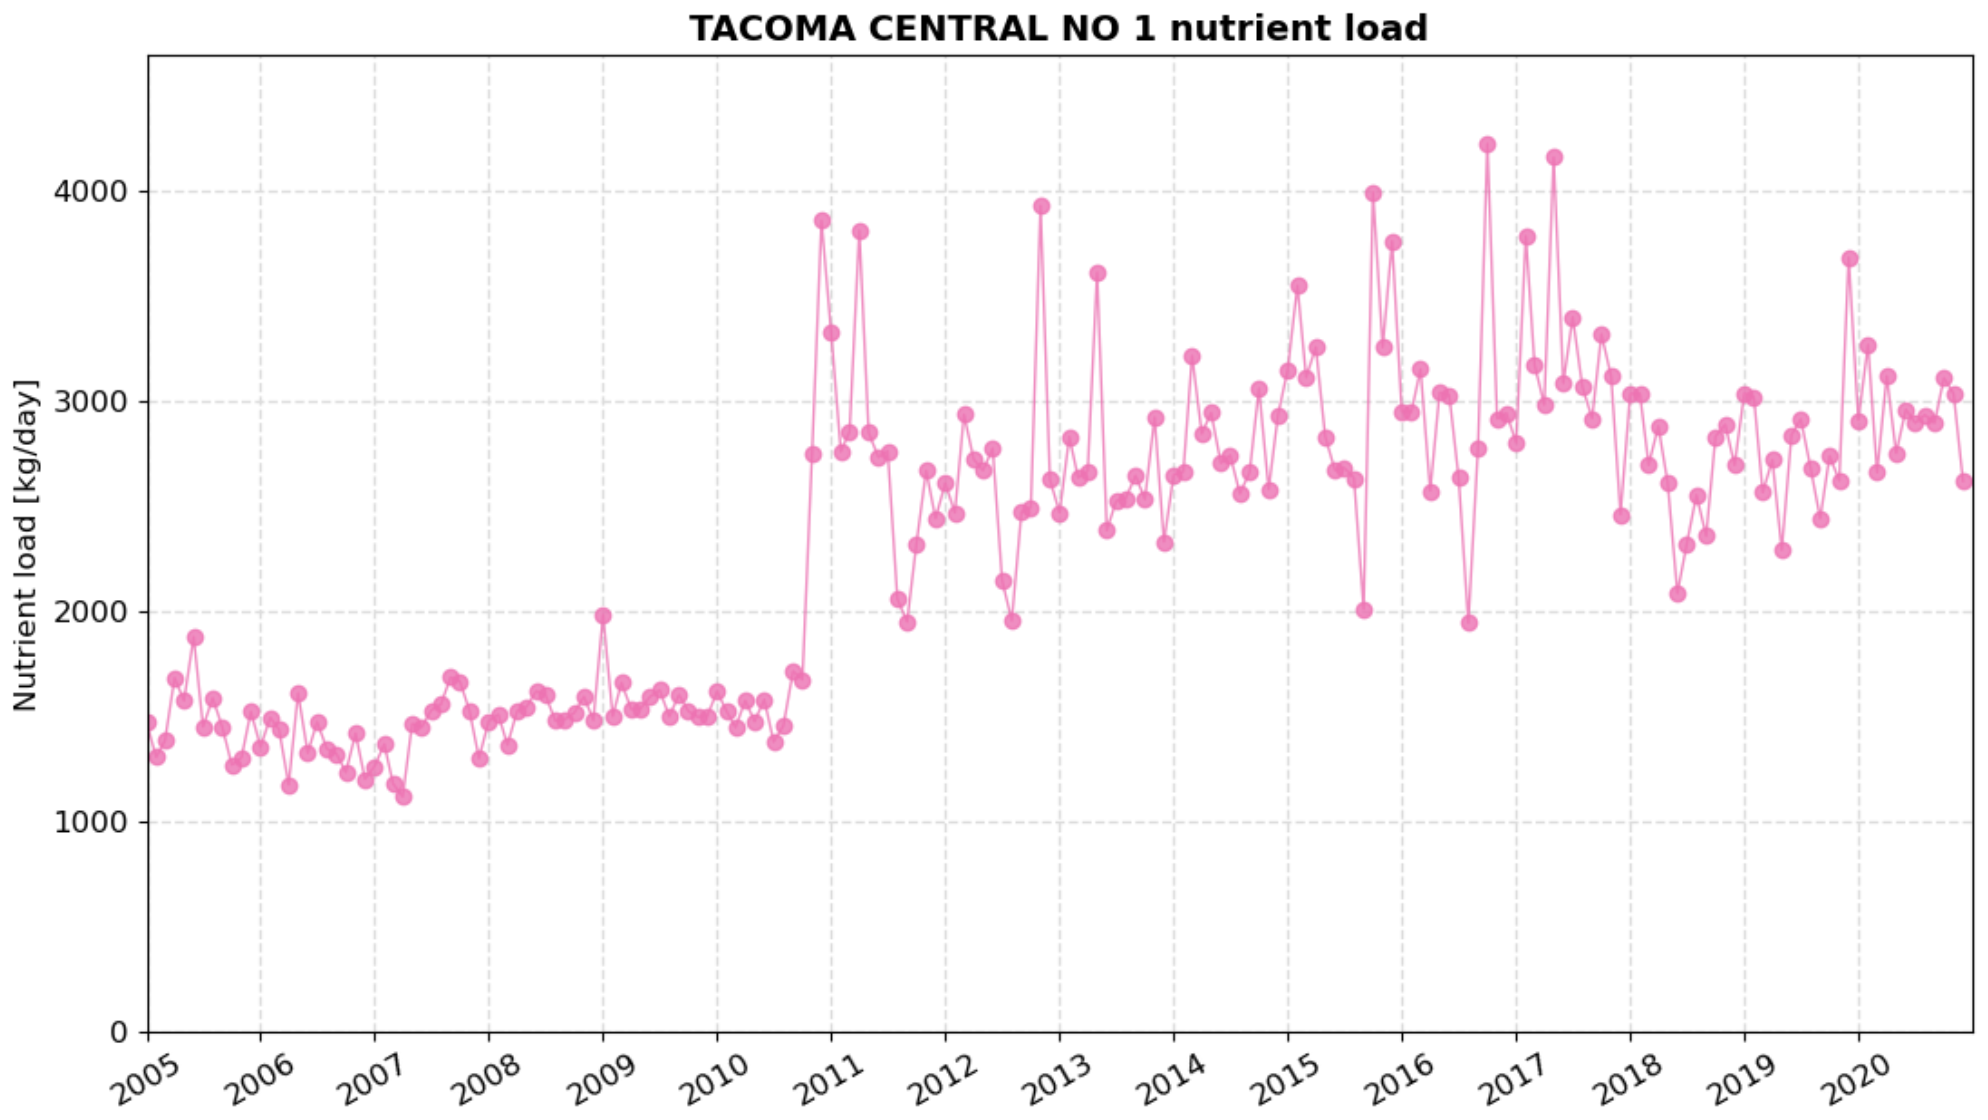
Fig 6. Tacoma Central No 1 nutrient load profile from Wasielewski et al. (2024).
Experiment design
Not all WWTPs are covered under the (now void) Nutrient General Permit. For instance, Canadian WWTPs do not apply. My original plan was to set nutrient concentrations of all WWTPs to zero. A new, alternative, idea is to set only the PSNGP WWTPs to zero.