Launched WWTP Experiments
This past week I finally launched the loading and no-loading WWTP experiments! In this blog post, I cover some nuances in the TRAPS code, share some initial results, and list my to-dos. More details below.
Nuances in the code
Weird WWTPs
As we discussed previously, I am continuing to use climatologies for the WWTPs that only appear in the old Mohamedali et al. (2020) dataset. Many of these WWTPs discharge to Canadian waters.
Though climatologies seemed mostly appropriate for these plants, there were a few large dischargers that contained some oddities (Figure 1). Despite these oddities, I am still using climatologies to prevent extra complexity in the data handling. The oddities are described below:
- The Clover Point WWTP has a large spike in nutrient loads between 2013 - 2015. This spike shifts the entire climatology up. I could not confirm an explanation for this spike. Given the timing, however, I speculate that it is related to re-routing of plumbing while a new WWTP was being constructed in the area.
- The Macaulay WWTP appears to have a sudden jump in DIN load starting in 2006.
- The NW Langley WWTP load appears to have steadily increased over the full time period of the Mohamedali et al. (2020) dataset.
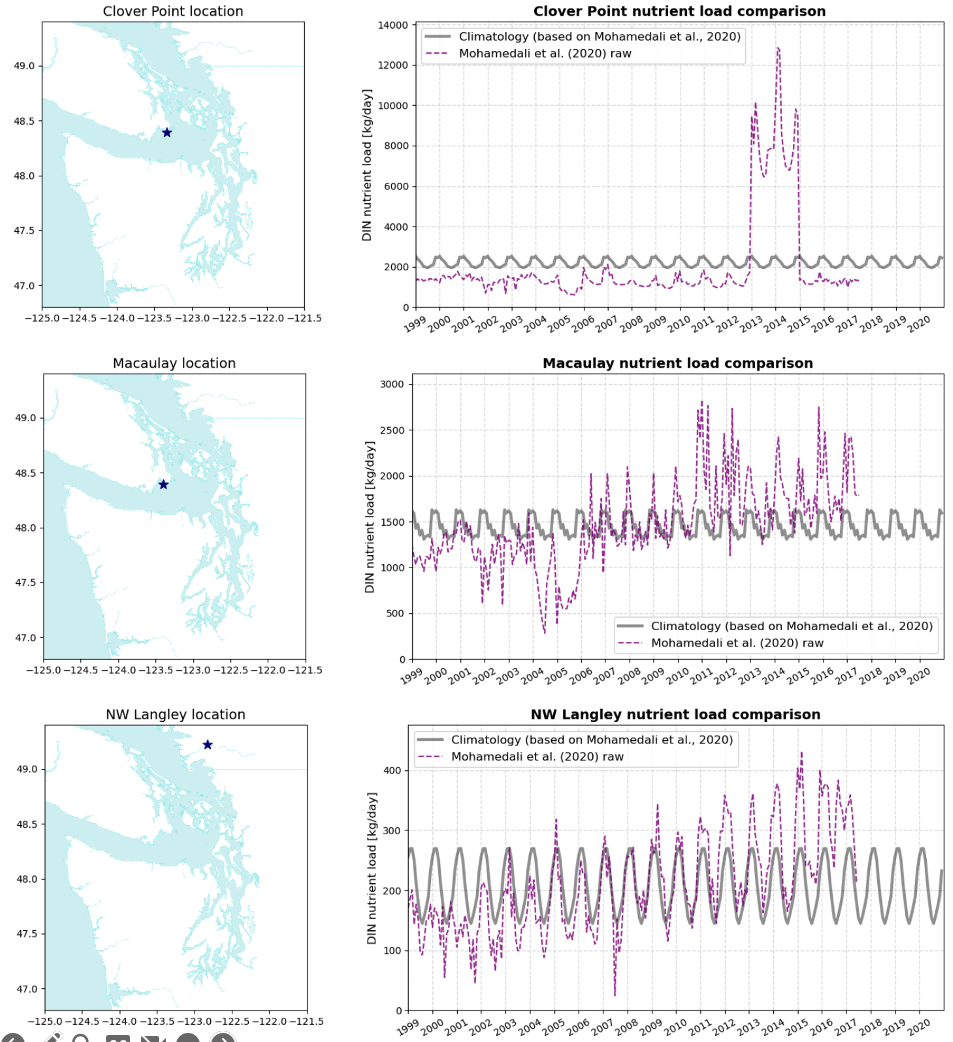
Fig 1. Large WWTPs in the Mohaedali et al. (2020) dataset with oddities. Top row: Clover Point WWTP. Middle row: Macaulay WWTP. Bottom row: NW Langley WWTP. The left column shows the location of the WWTPs. The right column shows a time series of the WWTP DIN loads using the raw data (dashed magenta) and climatologies (solid gray).
Climatology Error
While I reworked the TRAPS code, I caught an error in the climatology handling. The good news is that this seems like a minor error. The bad news is that this error is present in the current LiveOcean forecast!
When I generated climatologies, I saved the data for every WWTP and tiny river in a pickle file with a length of 366. The length is 366 because there is one value for flow, nitrate, etc. for every day of the year. To accomodate leap years, there is a value for Feb 29, which is why the pickle file has length 366 instead of 365.
The problem lies in the indexing of this pickle file for non-leap years. To generate TRAPS forcing, the older version of the code converted the date (e.g. Mar 1, 2014) into a day-of-year index. Then it used this index to access the climatology value. This works perfectly fine for days in a leap year. But for days in a non-leap year, such as Mar 1, 2014, this index is off by one.
In the new version of the code, I added some lines that check whether the date is in a non-leap year and later than Feb 28. If it is, then I now shift my day-of-year index forward by one.
Overlapping WWTPs
Lastly, I added a bit of code to handle cases of WWTPs being mapped to the same LiveOcean grid cell.
If two WWTPs from the Mohamedali et al. (2020) dataset are mapped to the same grid cell, then they are consolidated into one source where the flowrate is the sum of the two sources, and the concentrations are the weighted average (by flowrate) of the two sources.
I conduct the same consolidation if two WWTPs from the Wasielewski et al. (2024) dataset get mapped to the same grid cell.
Note that there are actually zero WWTPs that get mapped to the same grid cell– but my code is prepared just in case!
However, I do not have code that handles if a Moh20 and a Was24 WWTP get mapped to the same grid cell. This is because the code currently handles the two data sources independently. For now, I have simply added a warning statement that will notify a user if two WWTPs from the two different data sources get mapped to the same grid cell (Fig 2). This could be an issue in the future if WWTPs are added to a version of LiveOcean with a coarser grid resolution.
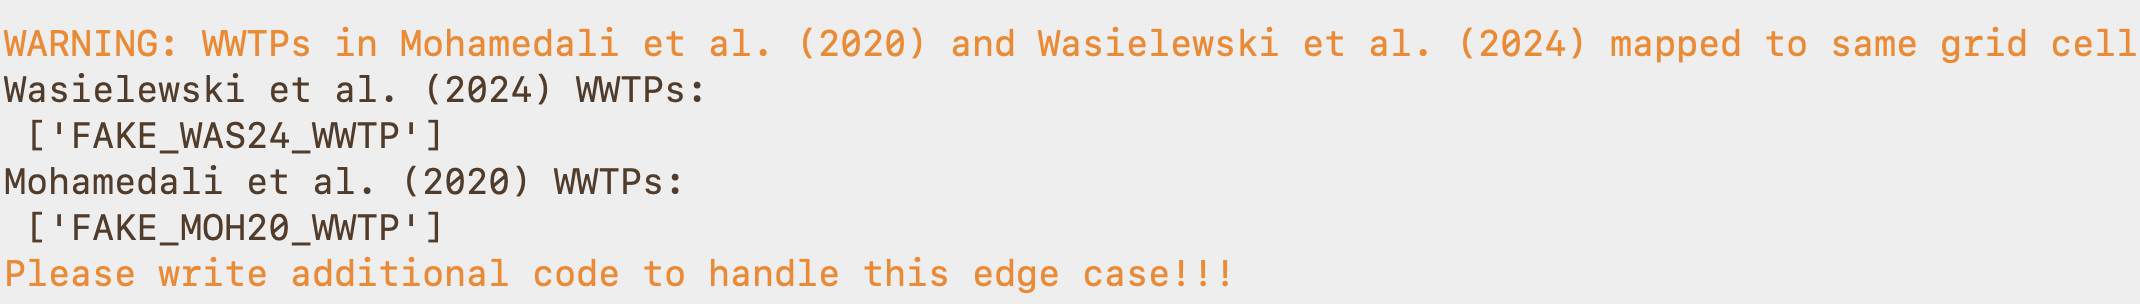
Fig 2. Warning statement printed by the forcing-generation code in the case that a Moh20 and Was24 WWTP get mapped to the same grid cell.
First peek at results (and bit-reproducibility issues)
To verify that the I set things up correctly, I compared the daily average model output file of the loading and no-loading runs after one day of run time. For now, I conducted these comparisons by looking at plots of the difference between the two simulations. I plan to write more robust scripts that test for bit-reproducibiliy soon.
Based on these figures, it appears that the hydrodynamics are bit-reproducible as the u-velocity fields seem to be the same in both model runs (not shown).
However, I see some issues in the biogeochemistry fields. Figure 3 shows the difference in DIN between the two runs (loading minus no-loading) at the surface and bottom vertical layers. As we would expect, the loading run has higher DIN concentrations that are concentrated near the locations of WWTPs in Puget Sound, Victoria, and Vancouver. I am also seeing some unexpected noise. The noise is most evident on the western side of Vancouver Island, where there are no WWTPs in the model.
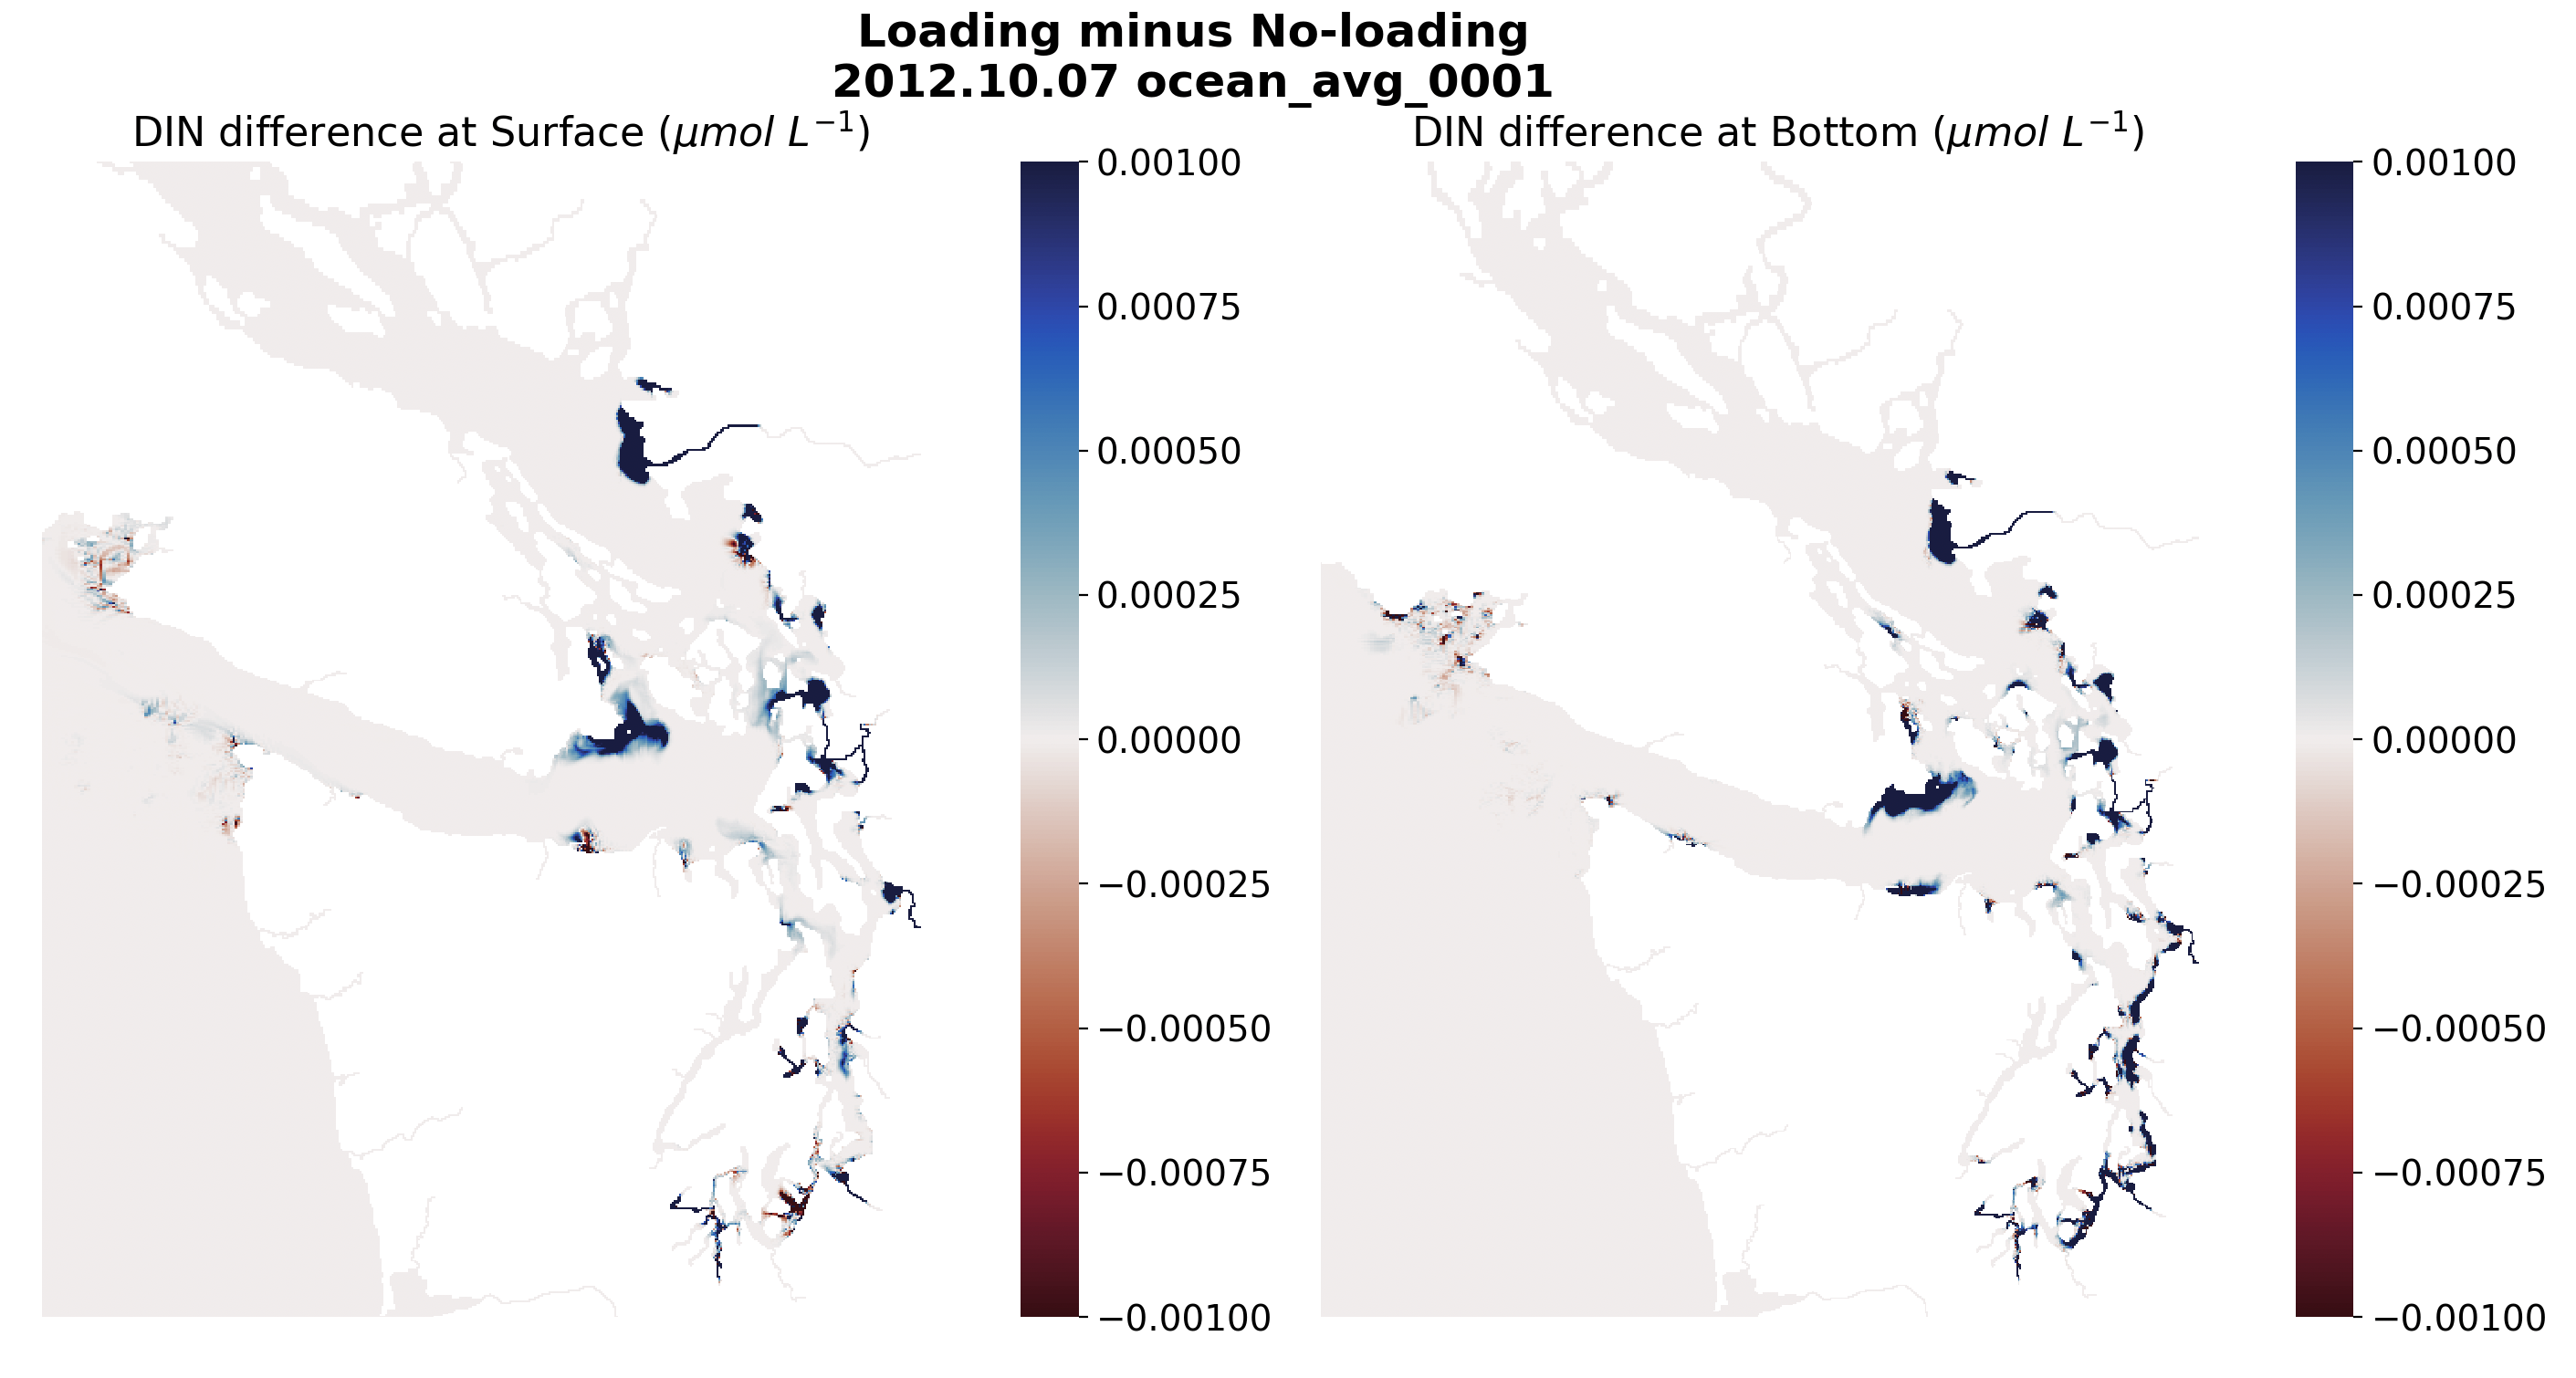
Fig 3. Comparison of DIN concentration after one day of run time between the two runs (loading minus no-loading). The left panel shows surface differences. The right panel shows bottom differences.
Thus, it appears that we are still grappling with bit-reproducibilty issues in the biogeochemistry fields. This is true despite having increased nudging to climatology by a factor of 100 for all bgc state variables.
Next steps
I am using a crontab that sends me email updates on the model status. Thus, I can keep an eye on how the simulation is doing while I work on other things.
My plans for the coming weeks, sorted from highest to lowest priority:
- Finish Paper 1
- Re-organize results/discussion to clarify narrative
- Add schematic showing the different budget terms in an arbitrary inlet
- Incorporate comparisons to data reports published by Puget Sound Ecosystem Monitoring Program
- Re-visit data analysis
- Am I using a statistical test that assumes normality, even though the data are not normally distributed?
- Are consumption rates higher in the Spring in hypoxic inlets compared to oxygenated inlets? (trying to explain d/dt DO)
- Finish cleaning code and write READMEs
- Write script to check bit-reproducibility of model runs
- And explore other options to address bit-reproducbility issue
- Come up with list of analysis plans for WWTP experiment
- Dye release?
- Add DIN to no-loading run at West Point only beginning in 2017?
- Budgets?
- Begin model-data commparison after 2013 finishes running
- Generate climatologies for new WWTPs for post-2020
- Write README and submit pull request to incorporate new WWTP data into production version of LO code