Statistical Tests and Noise
This week I made quite a bit of progress on Paper 1, but I got stuck on correcting the statistical tests that I used. Essentially, the d/dt(DO) data violate many of the assumptions of classical tests, so I am looking into alternatives.
I also looked at the evolution of NH4 differences between a model with West Point and a model without. I created some movies of the first 10 time steps, but do not see any noise appear during this time.
More details below.
Correcting Statistical Tests
One of the major findings in Paper 1 is that d/dt(DO) appears to be the same across all thirteen inlets during the drawdown period from mid-June through mid-August (Figure 1).
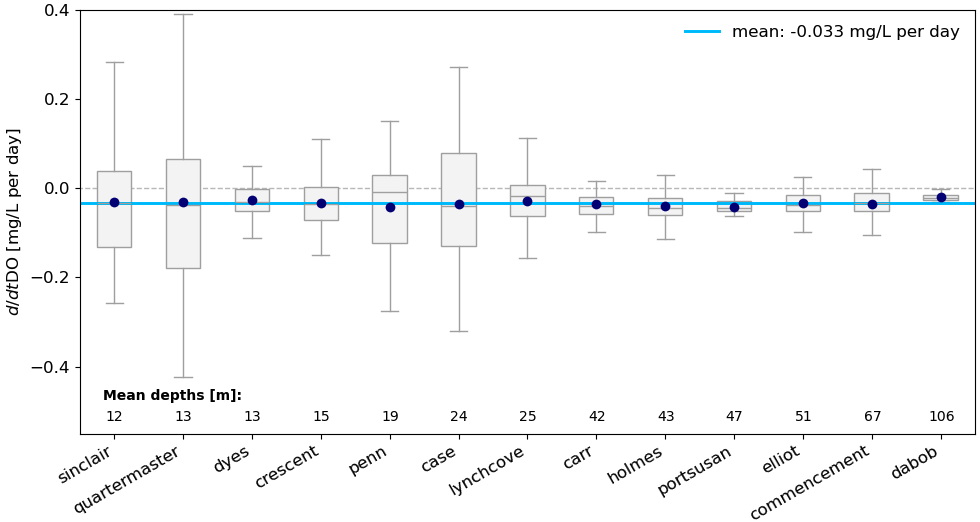
Fig 1. Boxplots of mid-Jun through mid-Aug net DO decrease rate of all 13 deep inlets. Data are daily d/dt(DO) rates. Each box contains the middle 50% of all data. The navy dot is the mean of an individual inlet. The blue line is the mean of all inlets. Inlets are ordered from shallowest to deepest.
I want to conduct a statistical test to more rigorously evaluate whether d/dt(DO) is truly the same.
Previously, I was using a Welch’s ANOVA test, which is robust to groups with different variances (and thus more appropriate than a standard one-way ANOVA test). However, Kate correctly pointed out that the Welch’s ANOVA may not be appropriate because the daily d/dt(DO) data don’t appear normally distributed (Figure 1). I tested for normality with a Shapiro-Wilk test, and confirmed that not all inlets have normally distributed data.
Kate recommended that I consider the Kruskal-Wallis test which compares the medians across different groups. This test is also robust to non-normally distributed data. After spending some time with this test, I then discovered that the Kruskal-Wallis test (and the ANOVA tests I was using earlier) requires independent samples in each group (i.e., inlet).
The problem is that my data are consecutive daily data, so I suspected some autocorrelation, which would mean that the data are not independent. Figure 2 shows autocorrelation plots of daily d/dt(DO) for each of the thirteen inlets. There is indeed some autocorrelation. I tried to subsample the data using a phase lag of 3 and 7 days, and I tried to aggregate data into weekly means, but the results are still too autocorrelated. Thus, the Kruskal-Wallis test might not be an appropriate option either.
From here, I went down a rabbit hole of trying to identify a better test and stumbled upon something called a Permutation Test, which does not have as many strict assumptions as other tests. I found a nice info page about Permutation Tests on this webpage. I reserved a textbook on Permutation Tests from the UW library, so I can set up the test properly.
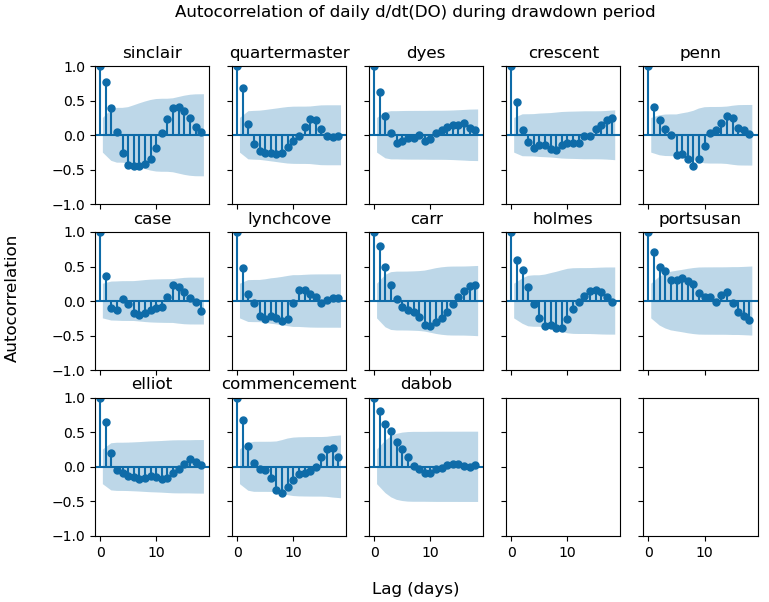
Fig 2. Autocorrelation plots of daily d/dt(DO) during the drawdown period.
All in all, this is still a work in progress. But hopefully through this work, we will end up with a more statistically correct conclusion.
First 10 Time Steps
I also set up our with/without West Point experiment to run for the first ten time steps. However, I did not see any indication of noise appearing and propagating in these first ten time steps. The video in Figures 3 and 4 show the evolution of surface and bottom NH4 differences between the two model runs.
Fig. 3 Comparison of NH4 concentration after one day of run time between the two runs (West Point minus no-West Point). The left panel shows surface differences. The right panel shows bottom differences. The pink circle denotes the location of West Point WWTP.
Fig. 4 Locations where NH4 differs between a model run with West Point and a model run without West Point. Black indicates that there are differences, and blue indicates that there are no differences. The pink circle denotes the location of West Point WWTP.
Since I don’t see any indication of noise in these runs, I am planning to run the simulation for longer, writing a history file after every 10 time steps (corresponding to 10 minutes) in hopes that we can eventually see the noise appear.