DO budget analysis with new interface depth
This past week I re-examined salinity profiles of each inlet and re-ran the DO budget code using 5 different interface depth criteria. Regardless of which interface criteria we choose, the major conclusions of Paper 1 are the same (hooray!). See below for more details. All results are reported for the year 2017.
Interface depths
Every single reviewer asked for justification for the 1/3 depth criteria we previously used as the dividing interface between the surface and deep layer of the inlet. After we discussed how to address these comments, I ran the DO budget code using 5 different interface depth criteria in all 13 inlets. The five criteria are:
- og: The original 1/3 depth criteria (1/2 for the shallower Sinclair Inlet and Quartermaster Harbor)
- drdz: Depth corresponding to the location of the maximum change in density (density profile averages over July, August, September)
- tef: Depth corresponding to the mid-point salinity between annual average Sin and Sout calculated from TEF. (salinity profile was averaged over July, August, September. I realize that this is a mis-match of time, but the results below suggest that the major results will not change if we average Sin and Sout over the summer months instead of the year)
- halocline: Depth corresponding to the location just below the halocline (salinity profile was averaged over July, August, September)
- oxycline: Depth corresponding to the location just below the oxycline (DO profile was averaged over July, August, September)
Figure 1 shows all five interface depths drawn on each inlet.
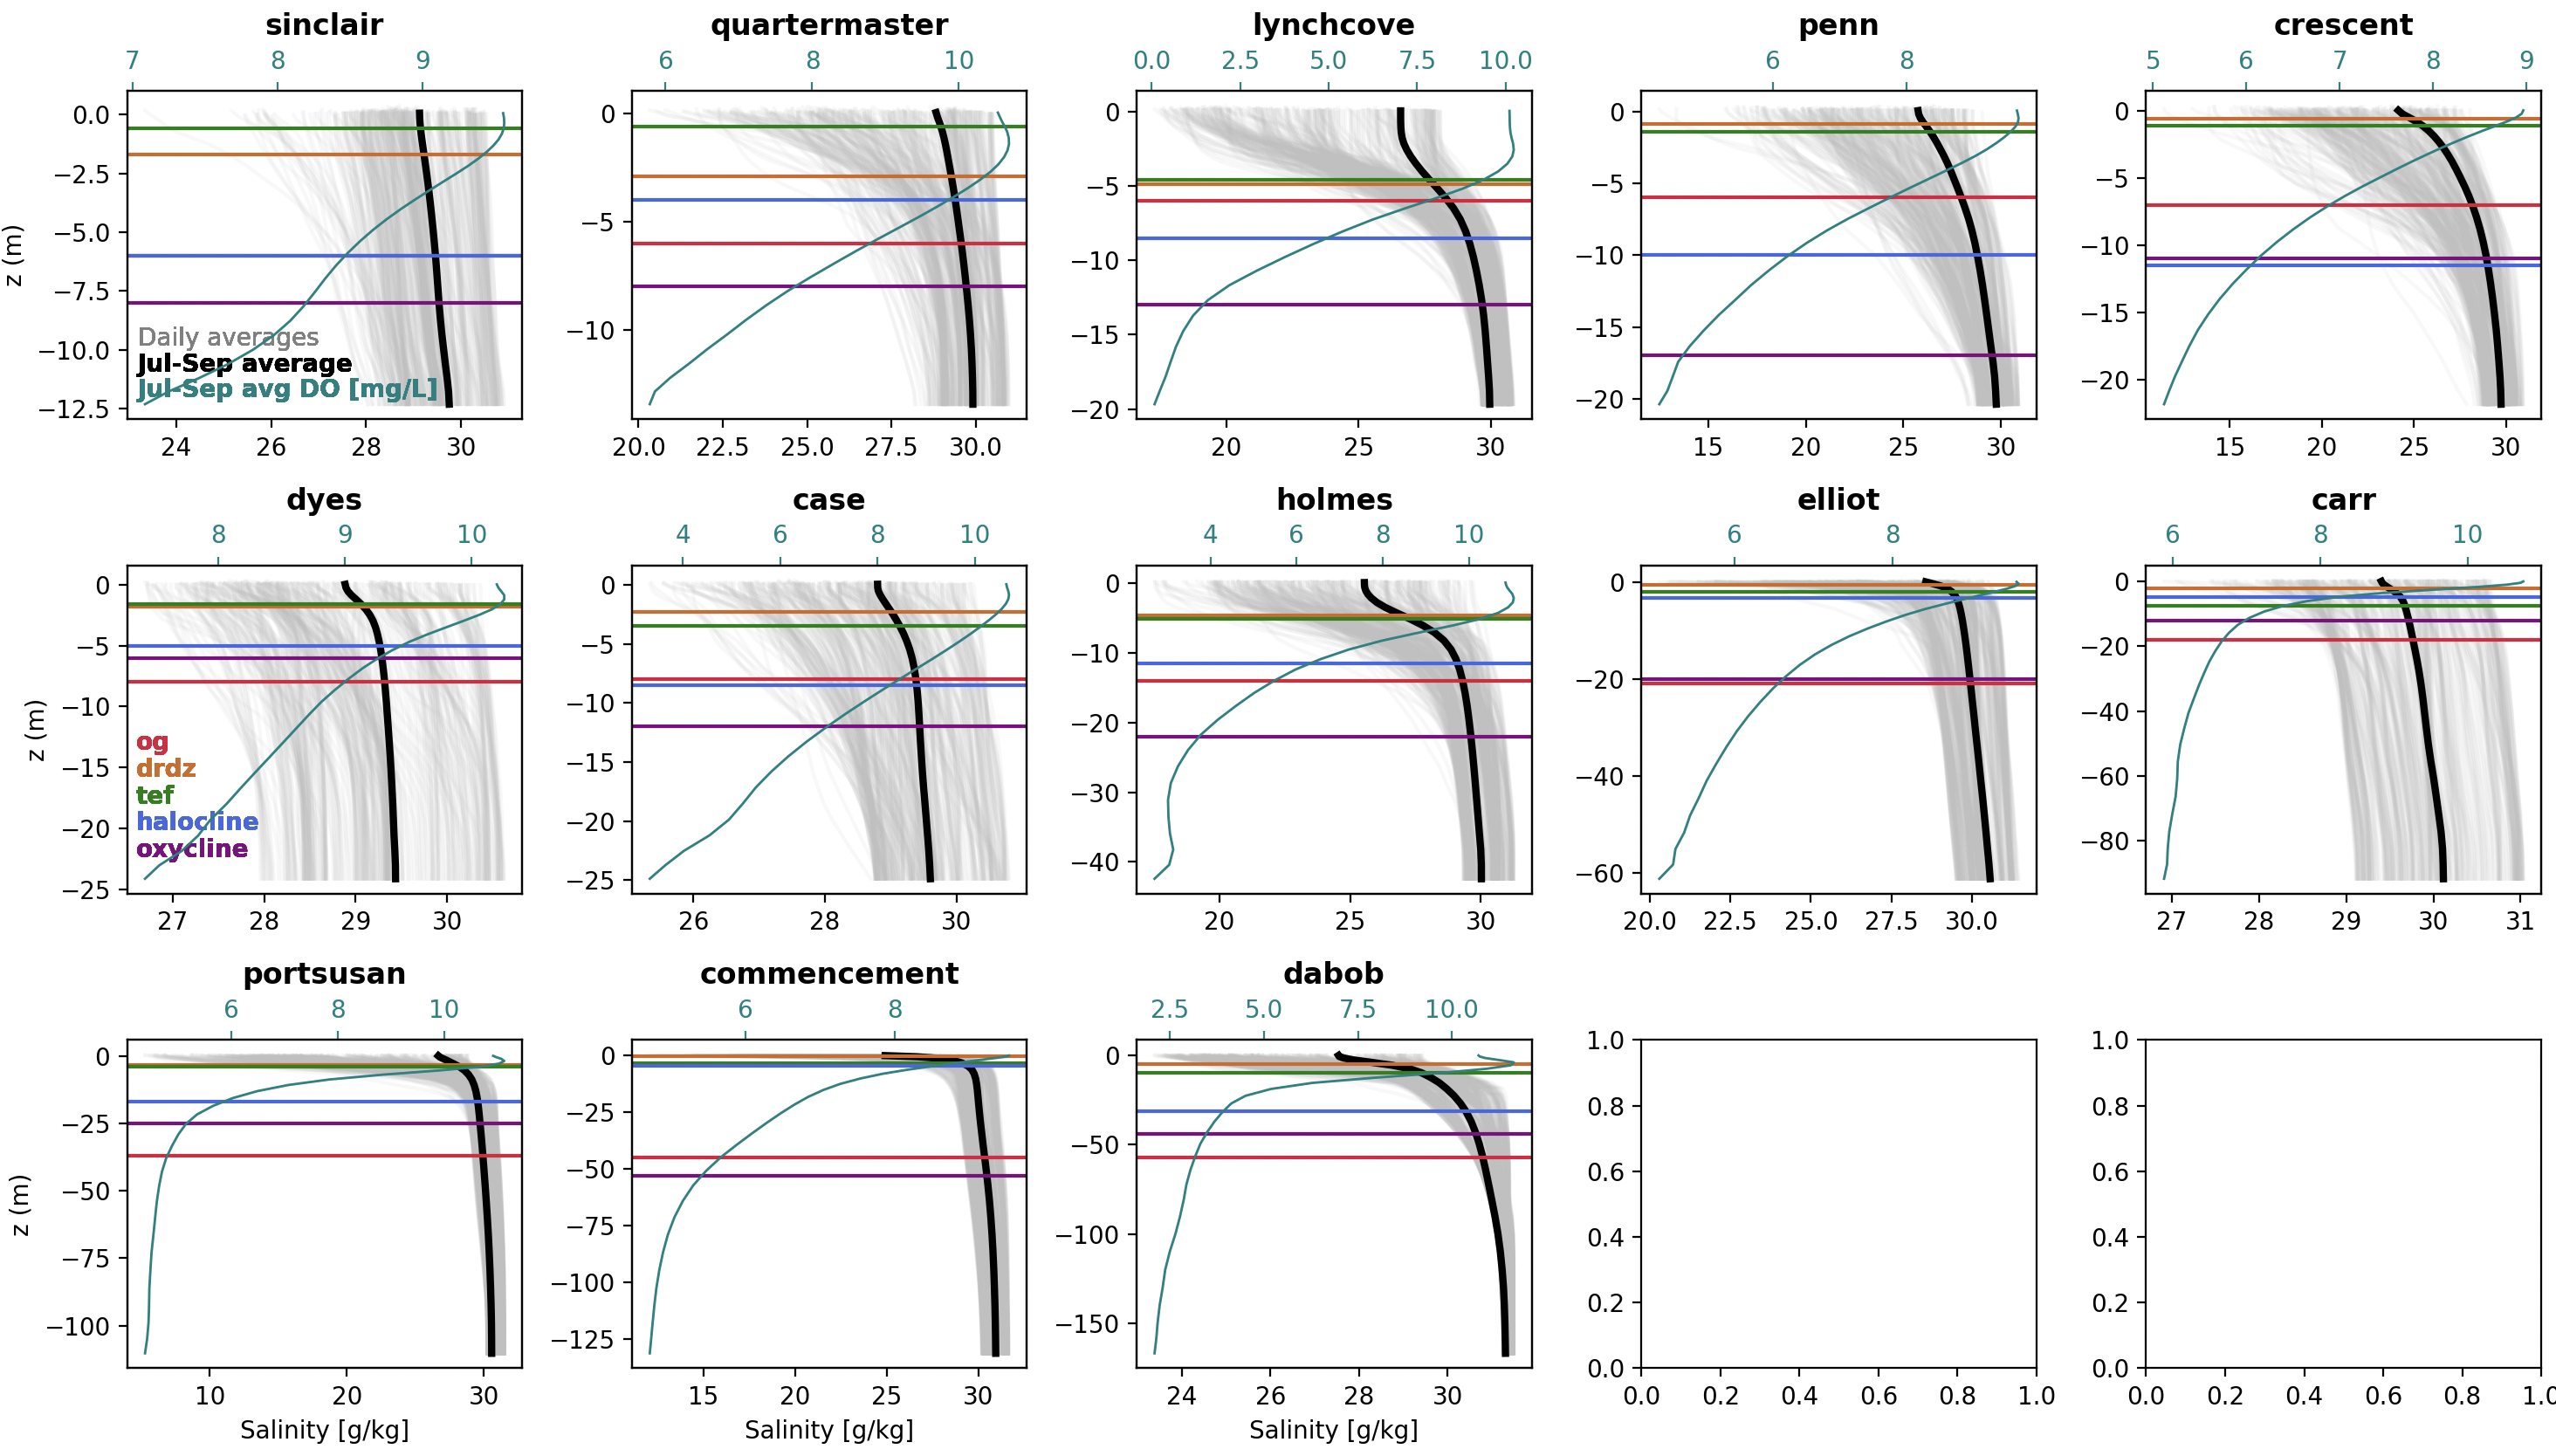
Fig 1. Interface depth locations. Each panel depicts a depth profile from one of the 13 inlets. The grey curves are daily-averaged salinity profiles for each day of the year 2017. The bold black curve is the July-September average salnity profile. The teal curve is the July-September average DO profile. Horizontal lines indicate different interface depth criteria. Og (red) is the original 1/3 depth criteria used in the first version of the paper, drdz (orange) corresponds to the depth with max change in density, tef (green) corresponds to the depth with a mid-point salinity between Sin and Sout, halocline (blue) corresponds to the depth just below the halocline, and oxycline (purple) corresponds to the depth just below the oxycline.
Analysis window
Each of the 5 different interface depth criteria produce different DOdeep results. Figure 2 shows time series of DOdeep for all 13 inlets.
In general, DO decreases from mid-July through mid-September and reaches a minimum during September and October in all inlets, regardless of the depth criteria. Thus, I define the “decline period” to be mid-July through mid-September for all depth criteria.
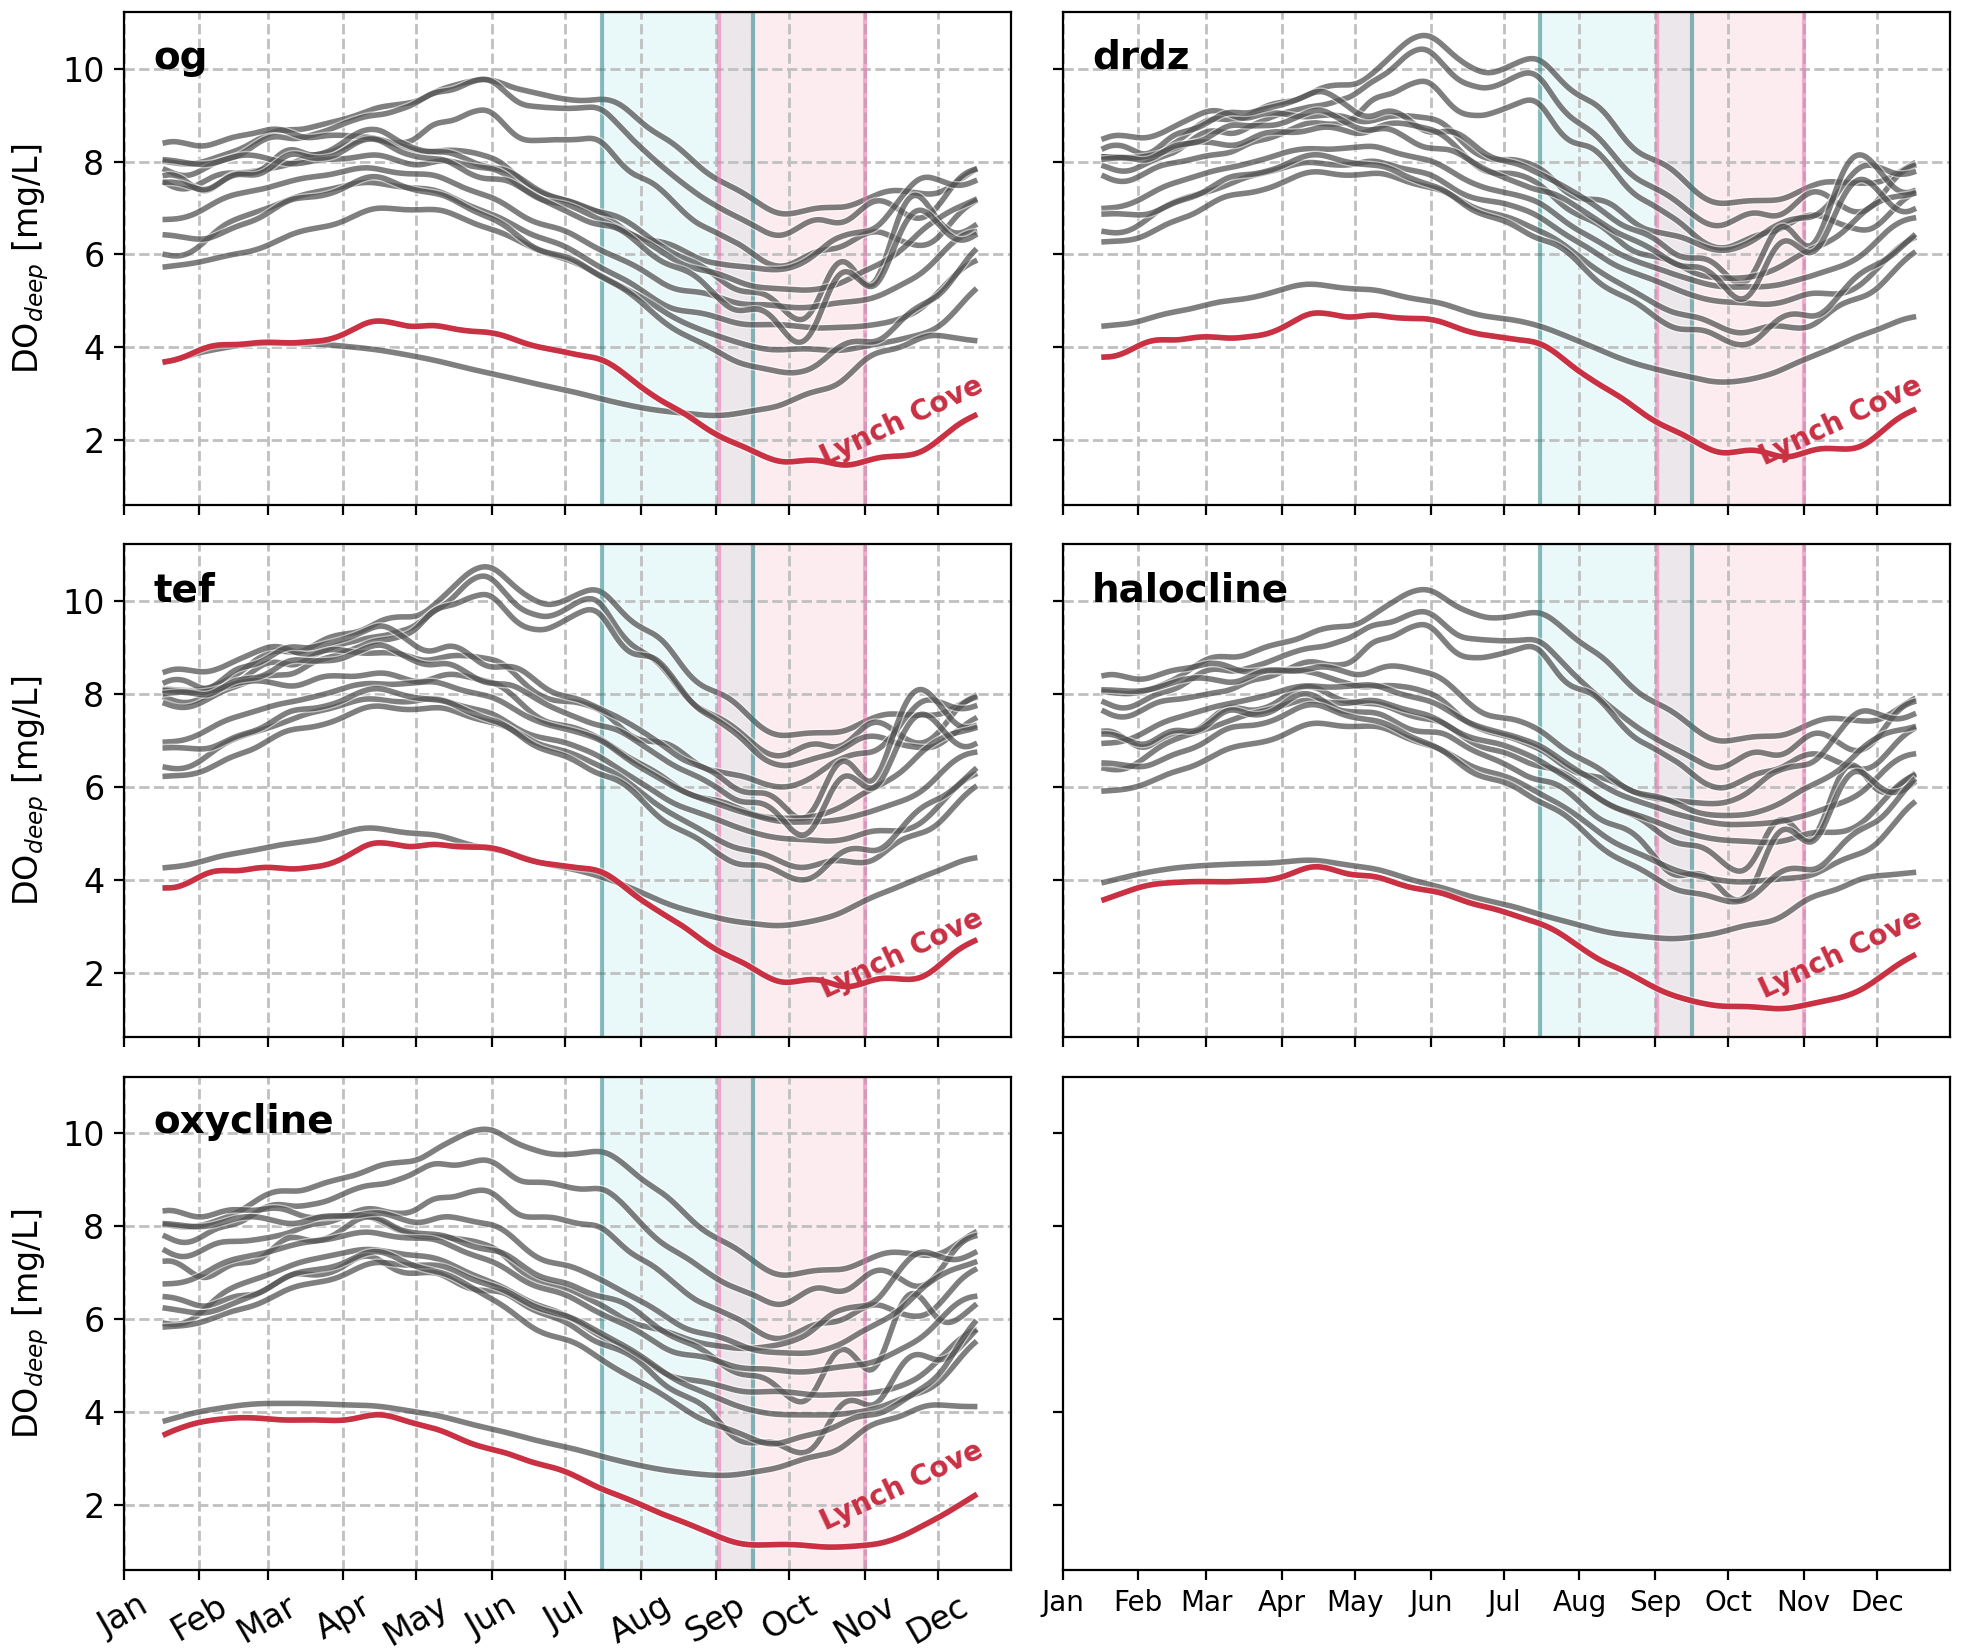
Fig 2. 2017 daily time series of mean deep layer DO in all thirteen terminal inlets, with a 30-day Hanning Window applied. The line corresponding to Lynch Cove is emphasized in red. The shaded blue period indicates the July 15 through September 15 DO decline period in which DOdeep is declining in all inlets. The shaded pink period indicates the hypoxic season in which hypoxic volume peaks in Puget Sound. Each panel represents a different interface depth criteria.
Note that in the previous manuscript draft, the decline period was defined from mid-June through mid-August, and the hypoxic period was defined from August through September. It appears that the new biogeochemistry module led to a change in timing of oxygen decline and hypoxia.
d/dt(DO)
One of the major conclusions of our paper is that the lowest DO inlets do not lose oxygen more quickly than higher DO inlets. Thus, it was important to assess whether this conclusion changes for different interface depth criteria using the new model results.
Figure 3 plots the mean d/dt(DO) rate [mg/L/day] during the decline period (mid-July through mid-September). The inlets are labeled on the x-axis, and each panel corresponds to a different interface depth criteria. Error bars are +/- one standard deviation of the mean (spread comes from averaging daily values). The dots are colored by the mean DOdeep concentration during the decline period, and I have roughly sorted the inlets from highest to lowest DO.
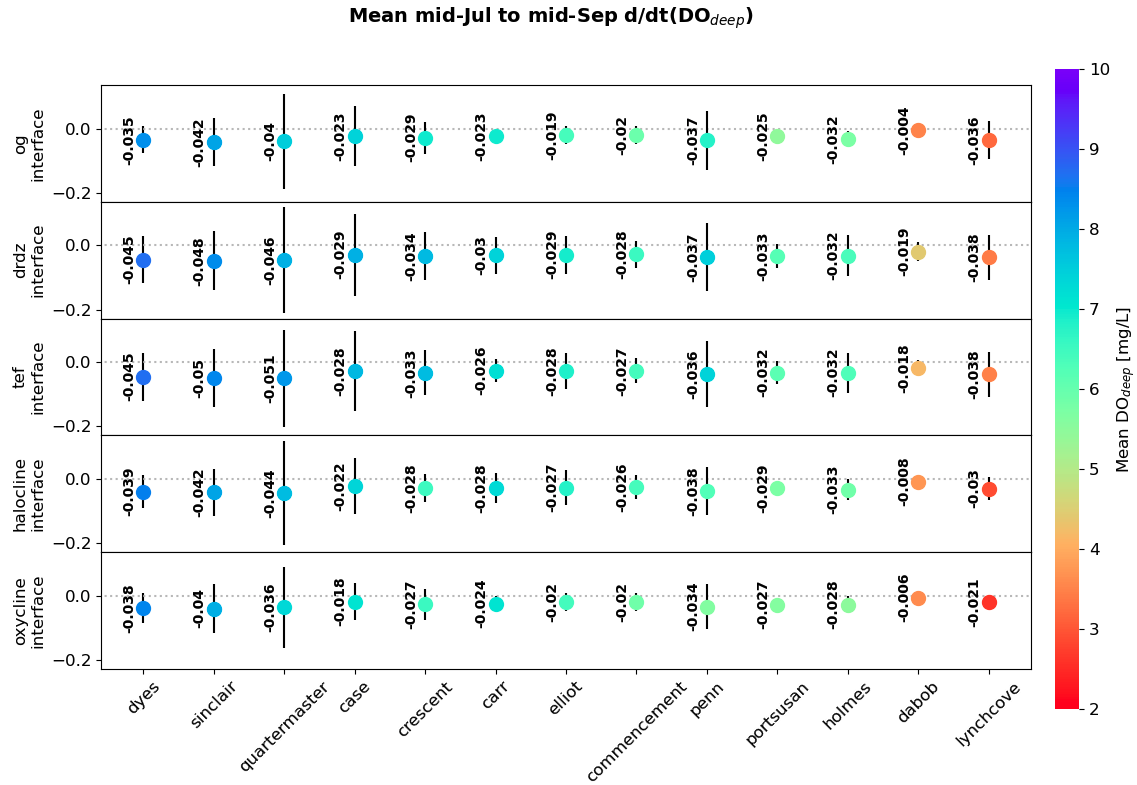
Fig 3. Mean volume-normalized d/dt(DO) of each inlet, using each interface depth criteria, averaged from July 15 - September 15. Units are in mg/L/day. Dot color corresponds to mean DOdeep concentration during the July 15 - Sep 15 decline period, and inlets are roughly sorted from highest to lowest DOdeep concentration. Error bars correspond to +/- one standard deviation.
Taking into account the size of the error bars, the mean d/dt(DO) rate of an inlet is similar regardless of the interface depth criteria used. Additionally, the lowest DO inlets do not have the fastest d/dt(DO) decline rate, which is consistent with the results from the first manuscript draft.
DOin and Tflush
Another important result from the first draft of our paper is that DOdeep is strongly influenced by DOin, and secondarily by Tflush.
Figure 4 shows monthly mean DOdeep vs. DOin colored by Tflush for the new model results, and for each of the five interface depth criteria. Although the exact locations of the points change depending on the interface depth criteria, the major conclusions remain the same. DOdeep is strong correlated to DOin, and inlets with DOdeep < DOin tend to have longer flushing times.
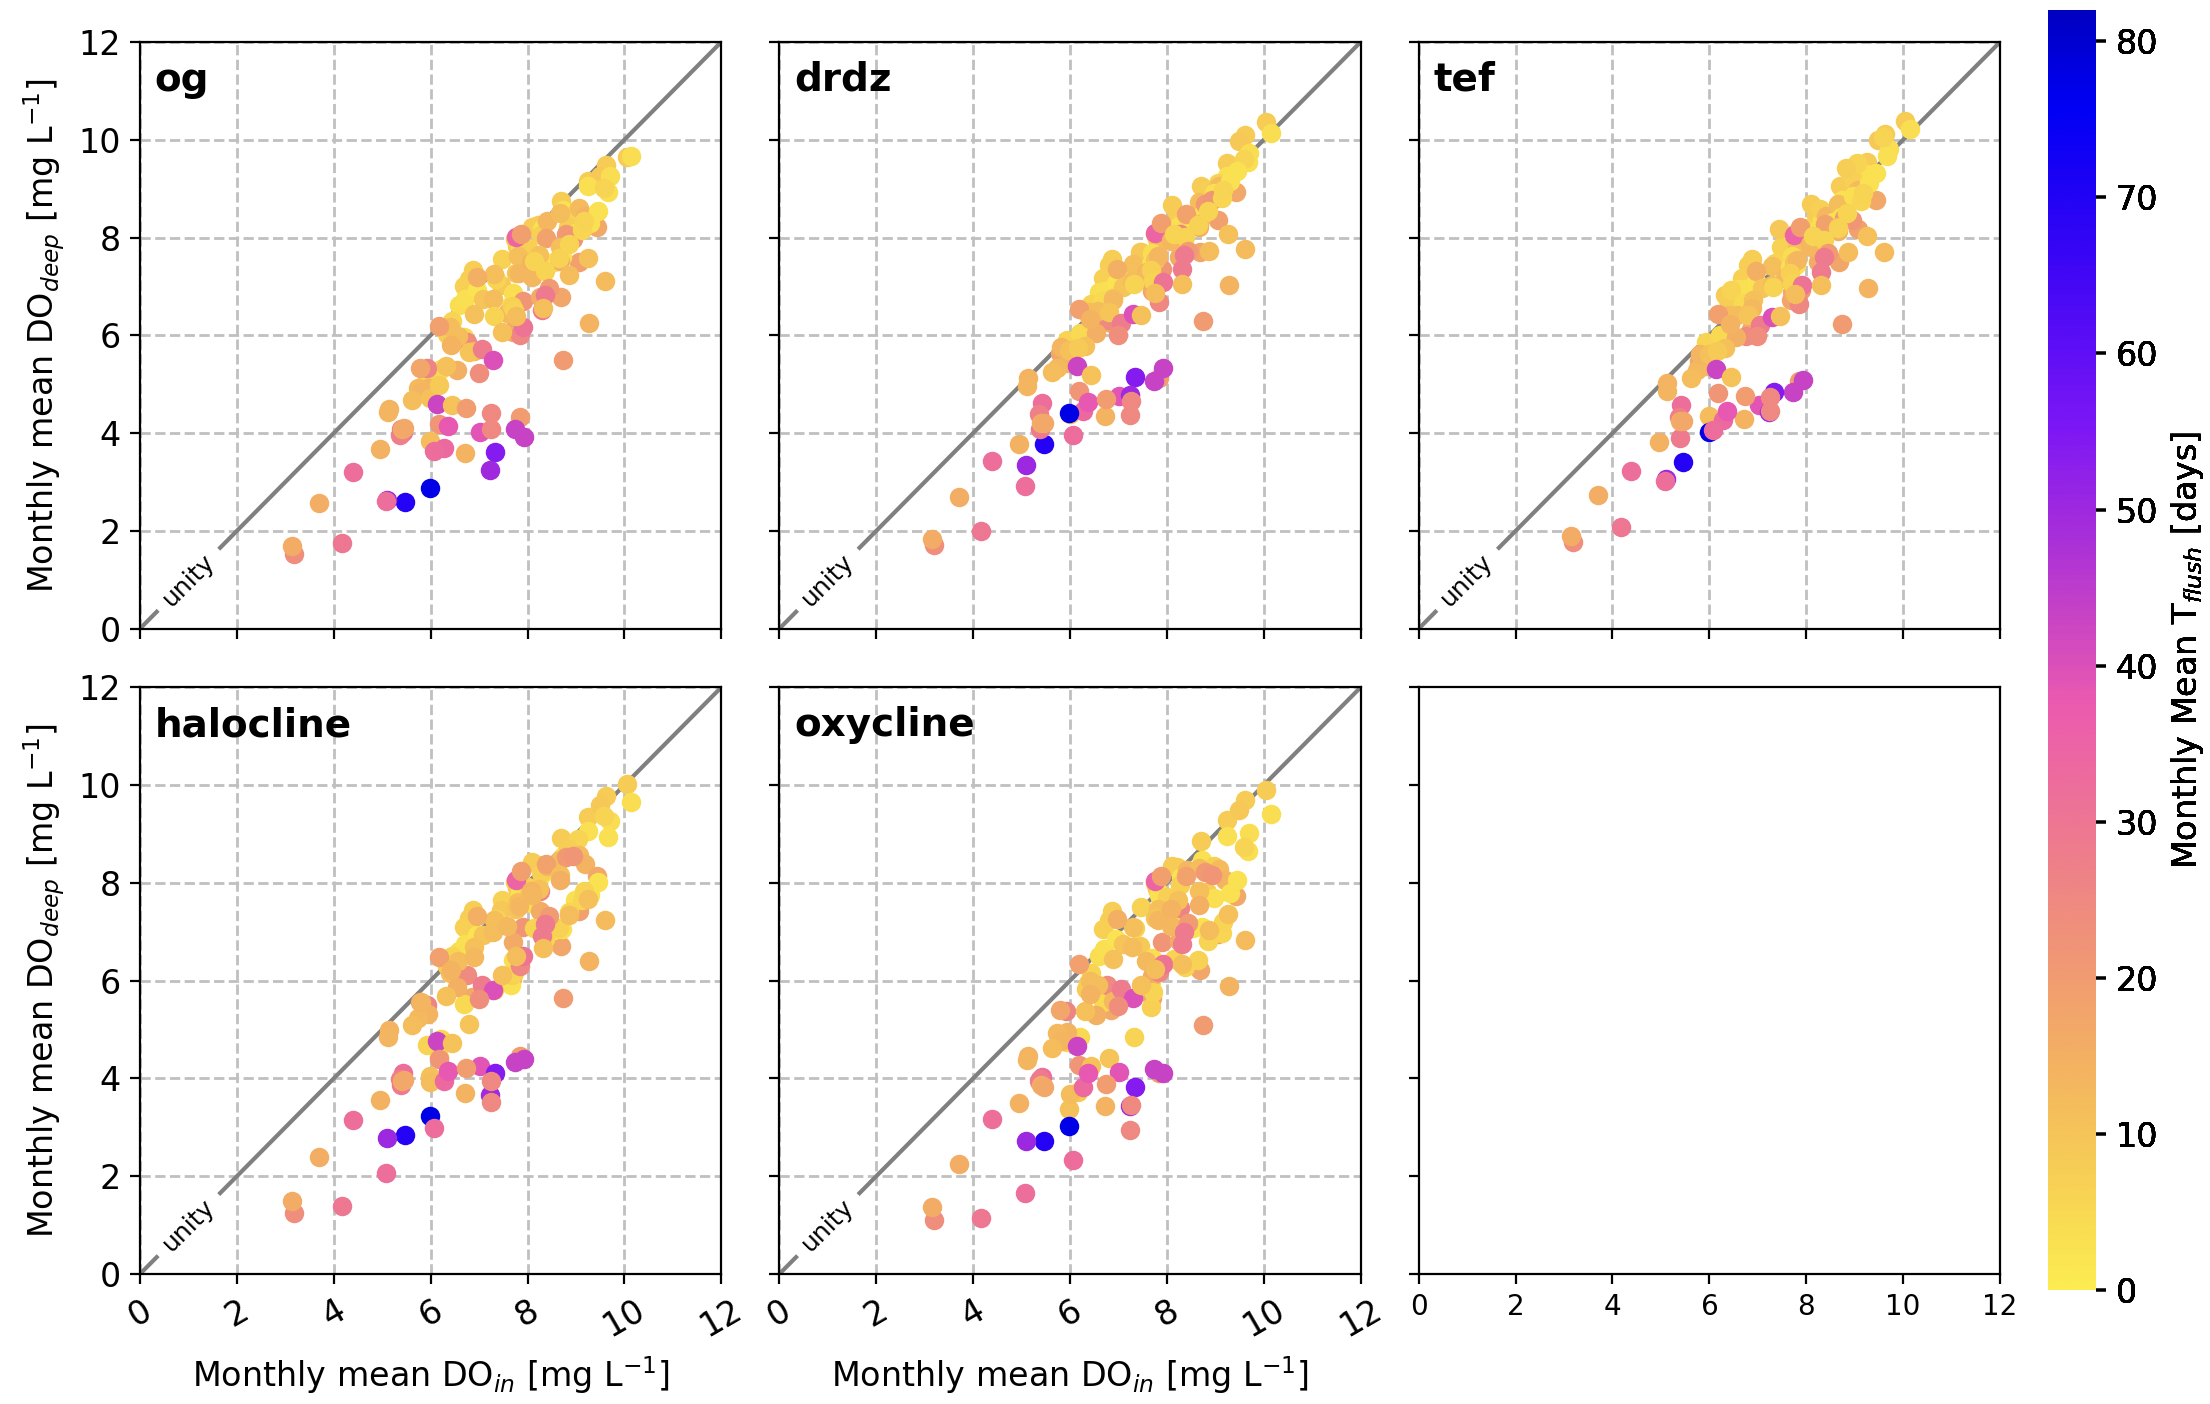
Fig 4. 2017 monthly mean deep layer DO vs. monthly mean inflowing DO concentration colored by monthly mean flushing time for all thirteen terminal inlets. The diagonal line
is unity. Each panel corresponds to a different interface depth criteria
Therefore, the major conclusion of our study remains the same, despite updating to a new version of the model, and regardless of the interface depth criteria used.
Given that the results are similar for all interface depth critera, I have decided to use the tef interface depth criteria for the second manuscript draft because it is most consistent with the methods used to calculate DOin, DOdeep, and Qin.
Do the budgets balance?
I also verified that the new DO budgets (using the TEF interface depth criteria) are balanced. Figure 5 shows surface and deep volume and DO budgets for Lynch Cove. The error is relatively small, which is good.
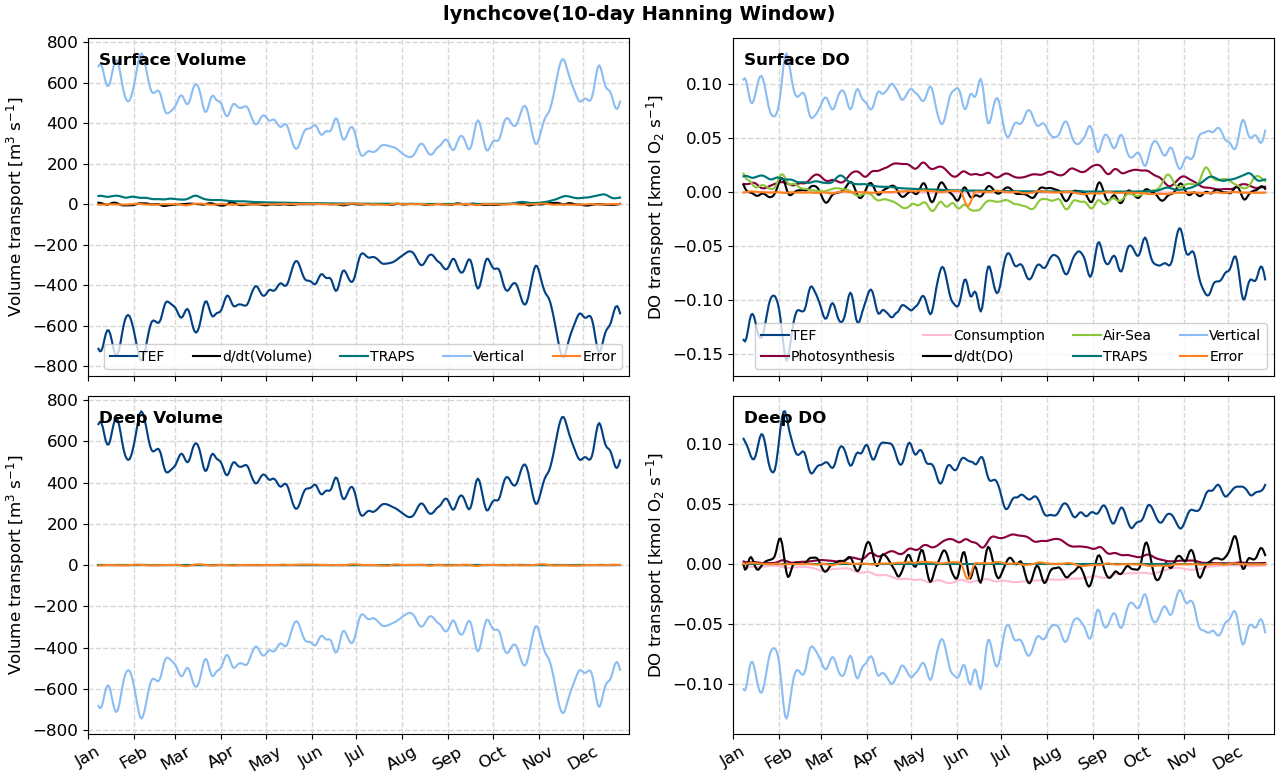
Fig 5. Example daily time series of surface and deep volume and DO budgets in Lynch
Cove for the year 2017 with a 10-day Hanning Window applied.
The deep DO budget for Lynch Cove looks similar to our result using the older version of the model. However, there is a strange blip in error at the beginning of June. Only Lynch Cove has a strange error blip. I am not sure what is causing this error blip, and it does not show up in the volume budget. Given that this error blip is outside of our DO decline period, and that no other inlets have an error blip, I have decided to proceed with the formal budget analysis.