Latest thoughts on WWTP loading experiment
My research over the past few weeks has focused on understanding why WWTP nutrients have the impacts that they have in Puget Sound.
So far, I have found that WWTP nutrients tend to shift phytoplankton bloom timing such that spring blooms are weaker while summer blooms are stronger. Additionally, the flux of NH4 and large detritus from Main Basin into South Sound and Whidbey Basin seems to be enhanced.
I am still looking towards additional analysis to complete before PECS.
What are we trying to investigate?
My primary investigation has been to understand the underlying mechanisms responsible for the spatial variability of WWTP impact to DO.
As a reminder, WWTP nutrients generally decrease DO everywhere across Puget Sound, but inlets in South Sound and Whidbey Basin appear to be more susecptible to WWTP nutrients than elsewhere in the estuary (Figure 1).
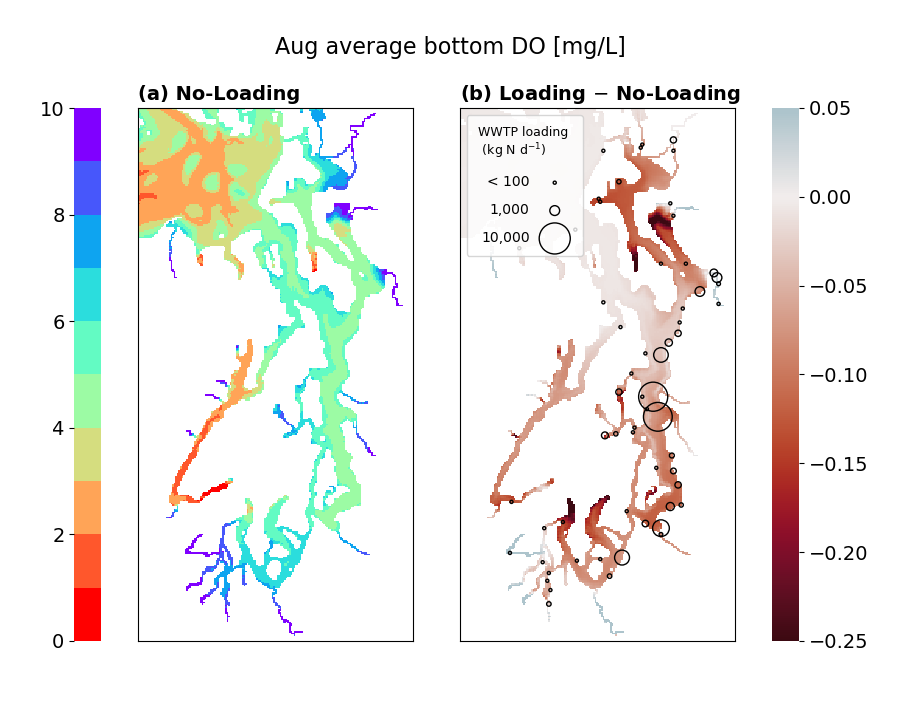
Fig 1. (a) Climatological mean bottom DO concentration in the No-loading run during the month of August (averaged over the years 2015-2020). (b) Difference in climatological mean August bottom DO between Loading and No-loading runs.
Some pieces of the puzzle
Phytoplankton blooms
One major part this investigation is answering “why does DO decrease in Puget Sound due to WWTP nutrients?” I thought that the answer to this question would be obvious: “WWTP nutrients increase the amount of phytoplankton blooms, which produces more organic matter that gets respired.” However, the answer to this question appears to be more nuanced.
Figure 2 shows a comparison of average phytoplankton concentration in each basin between 2015 through 2020 between the Loading and No-loading runs. Every single year, the spring phytoplankton blooms are larger in the No-loading run than in the Loading run. However, this pattern flips during the summer blooms, where the Loading run has large blooms than the No-loading run. These results suggest that WWTP nutrients do not solely alter the magnitude of blooms, but they also alter the timing of blooms. In particular, the timing of the blooms appear to be shifted later in the year.
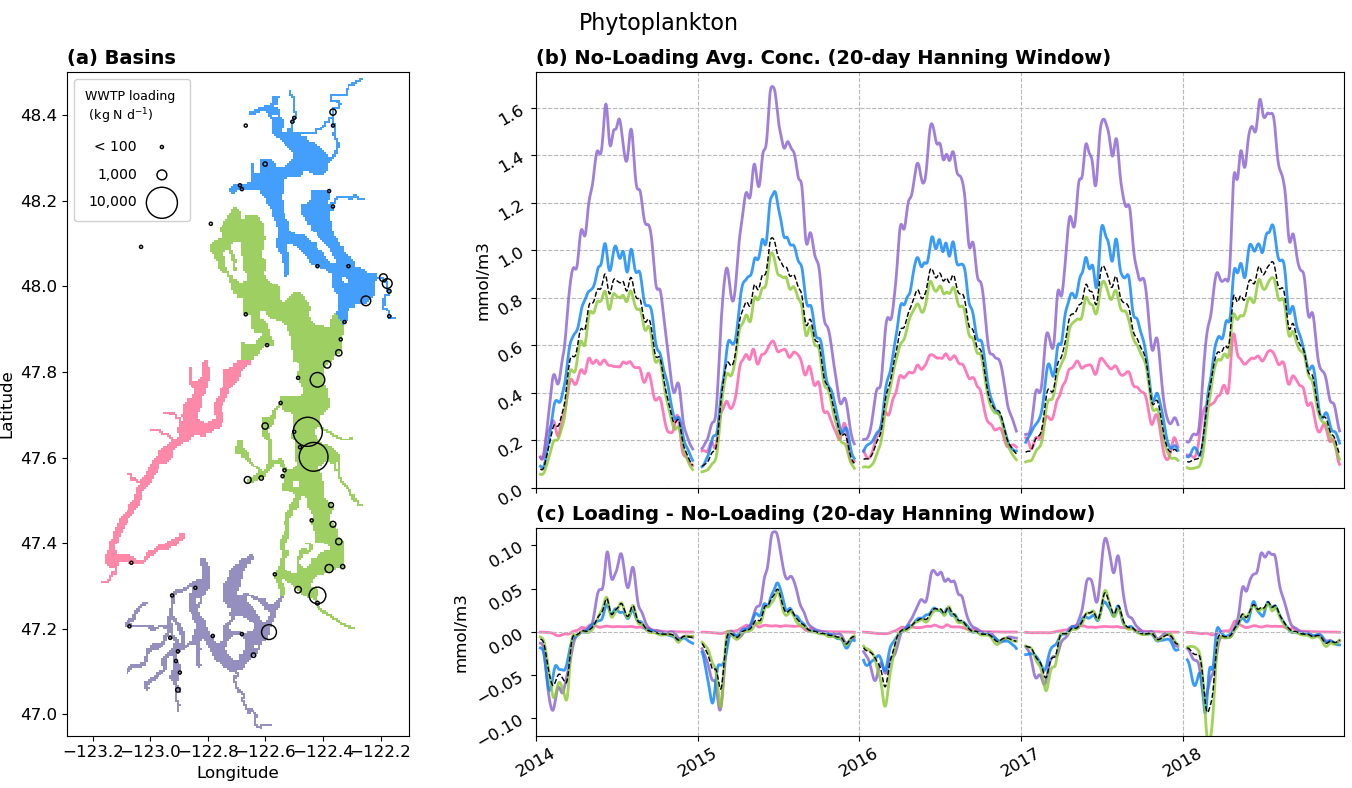
Fig 2. Average phytoplankton concentration in the different basins of Puget Sound. (a) Delineation of basin boundaries and location & discharge of WWTPs. (b) Average concentration in the no-loading run, partitioned by basin. The black dashed line represents the whole of Puget Sound. (c) Difference between the loading run and no-loading run average concentrations.
Not shown: I also time-integrated the standing stock of phytoplankton in both runs and found that the No-loading run has more cumulative phytoplankton than the Loading run per annum. This result is counterintuitive, and I plan to verify it in the future by time-integrating phytoplankton growth rate.
For now, my leading hypothesis for why the Loading run has lower DO is because WWTP nutrients create stronger summer blooms, which generates more organic matter during a time when there is stronger stratification and potentially weaker flushing due to low river discharge.
Changes to NPZD+O fluxes between basins
I tried to understand why South Sound and Whidbey Basin are more strongly impacted by WWTP nutrients by considering TEF fluxes of NPZD+O variables between the basin boundaries.
Figure 3 shows an example time series of NPZD+O TEF fluxes into Whidbey Basin over the year 2017.
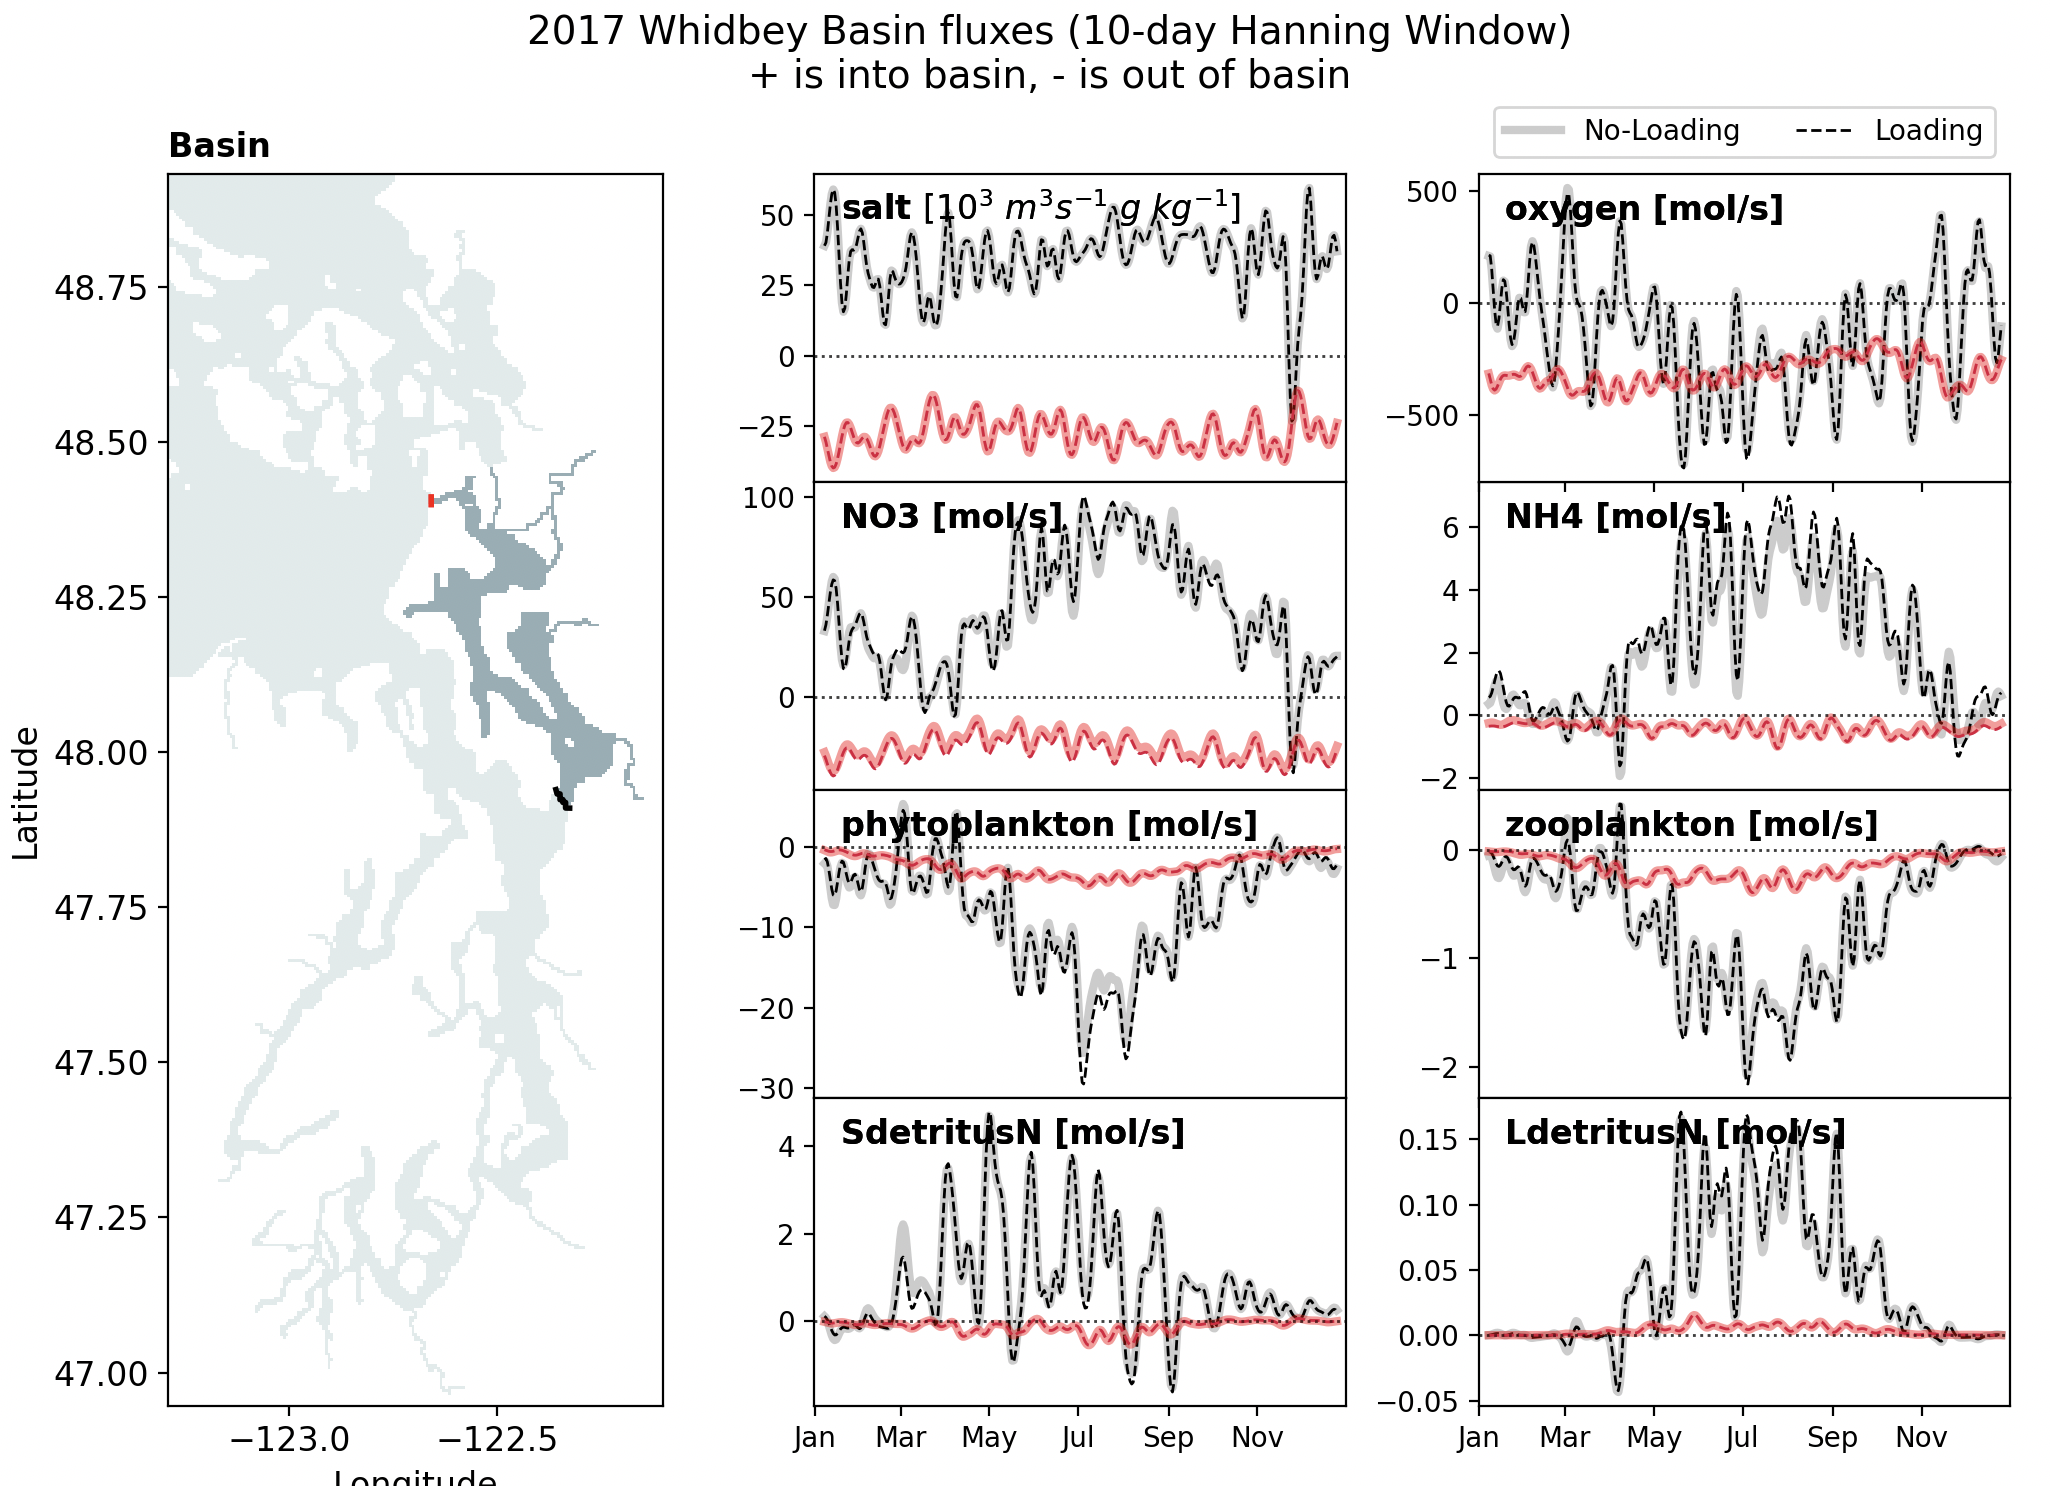
Fig 3. 2017 TEF fluxes of NPZD+O variables through the boundaries of Whidbey Basin. Basin boundaries are color-coded on the map, where red corresponds to Deception Pass and black corresponds to Possession Sound. Light-colored, solid lines are the No-loading run and dark-colored, dashed lines are the Loading run. The sign convention is that positive fluxes are going into the basin, while negative fluxes go out of the basin. The fluxes are net fluxes, and are the sum of inflow and outflow.
In general, I found the differences between the Loading and No-loading runs to be impossible to make out on this time series. Thus, I converted this flux information into something that provides more opportunities for interpretation…
Figure 4 shows maps of TEF fluxes for all of the NPZD+O state variables. All of the gray arrows are the average TEF fluxes during the year 2017 (imagine taking the average of the lines in Figure 3), while the red and blue colored arrows indicate a strengthening or weakening of the flux due to WWTP loads, respectively.
This map allows me to pick out which TEF fluxes are more strongly impacted by WWTP loads. Fluxes that stand out to me are the strengthening of NH4 and large detritus loading into Whidbey Basin and South Sound due to the introduction of WWTP nutrients. Perhaps more NH4 fuels stronger blooms in these basins, or perhaps more large detritus leads to stronger oxygen consumption.
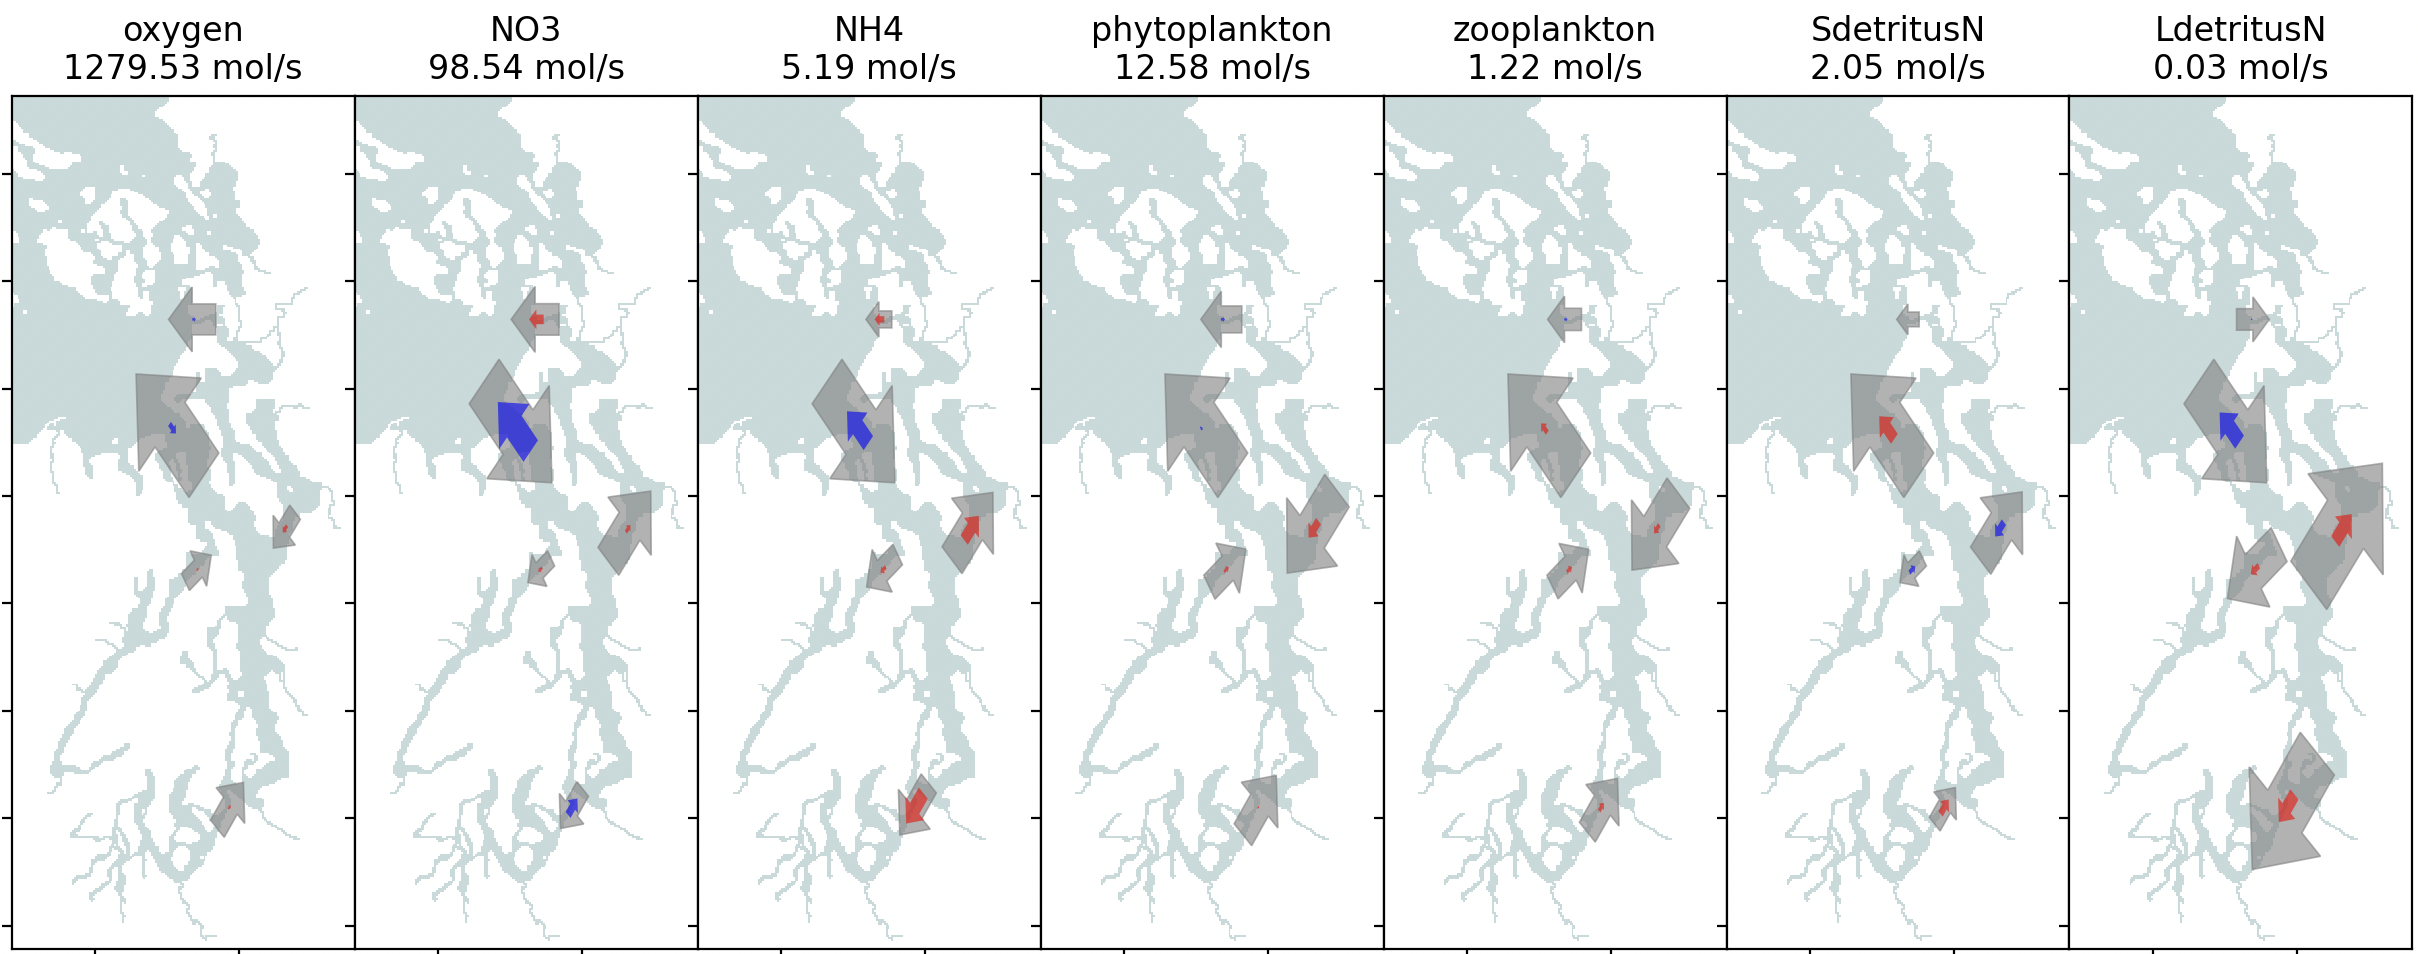
Fig 4. 2017 mean TEF fluxes of NPZD+O variables through the boundaries between each basin in Puget Sound. Gray arrows are the TEF fluxes in the No-loading run, and the arrow sizes have been normalized to the size of the No-loading flux through Admiralty Inlet, and the value of this arrow is given under the state variable name. Arrow area is proportional to flux. The blue and red colored arrows show the difference in the TEF flux between the Loading and No-loading runs. The red arrows indicate that the WWTP loads strengthen the TEF flux, while the blue arrrows indicate that the WWTP loads weaken the TEF flux. Here, the area of the colored arrows are proportional to the difference between the runs.
Looking at these fluxes alone do not fully explain why inlets in South Sound and Whidbey Basin are more susceptible to WWTP inputs; I need to also understand how the standing stock of NPZD+O variables changes within each basin.
Next steps
I still have many questions left to answer before we can fully describe the mechanisms leading to the modeled spatial distribution of lower DO across Puget Sound.
My next steps are to write scripts that allow us to look at:
- Phytoplankton growth
- Water column respiration
- Sediment oxygen demand
I plan to look at both maps and time integrals of these processes across each basin.
I am also interested if there are other ideas for key variables or mechanisms that would be worth investigating prior to PECS.