Poster outline for nutrient management exchange
Introduction
Goal
Understand the pathways through which wastewater treatment plant (WWTP) nutrients influence dissolved oxygen (DO).
Motivation
DO reaches dangerously low levels in several reaches of Puget Sound, most notably, Hood Canal. This poor water quality poses serious risks to ecosystems, including fish kills, as have been occuring this year. We seek to understand the pathways through which WWTP nutrients influence DO. Understanding these pathways will ultimately help inform potential solutions.
Methods: LiveOcean modeling experiment
Models serve as a tool to help understand what would occur if we could hypothetically turn WWTPs on and off. While models are useful, they are not exact truth, and we should interpret them with caution and curiosity.
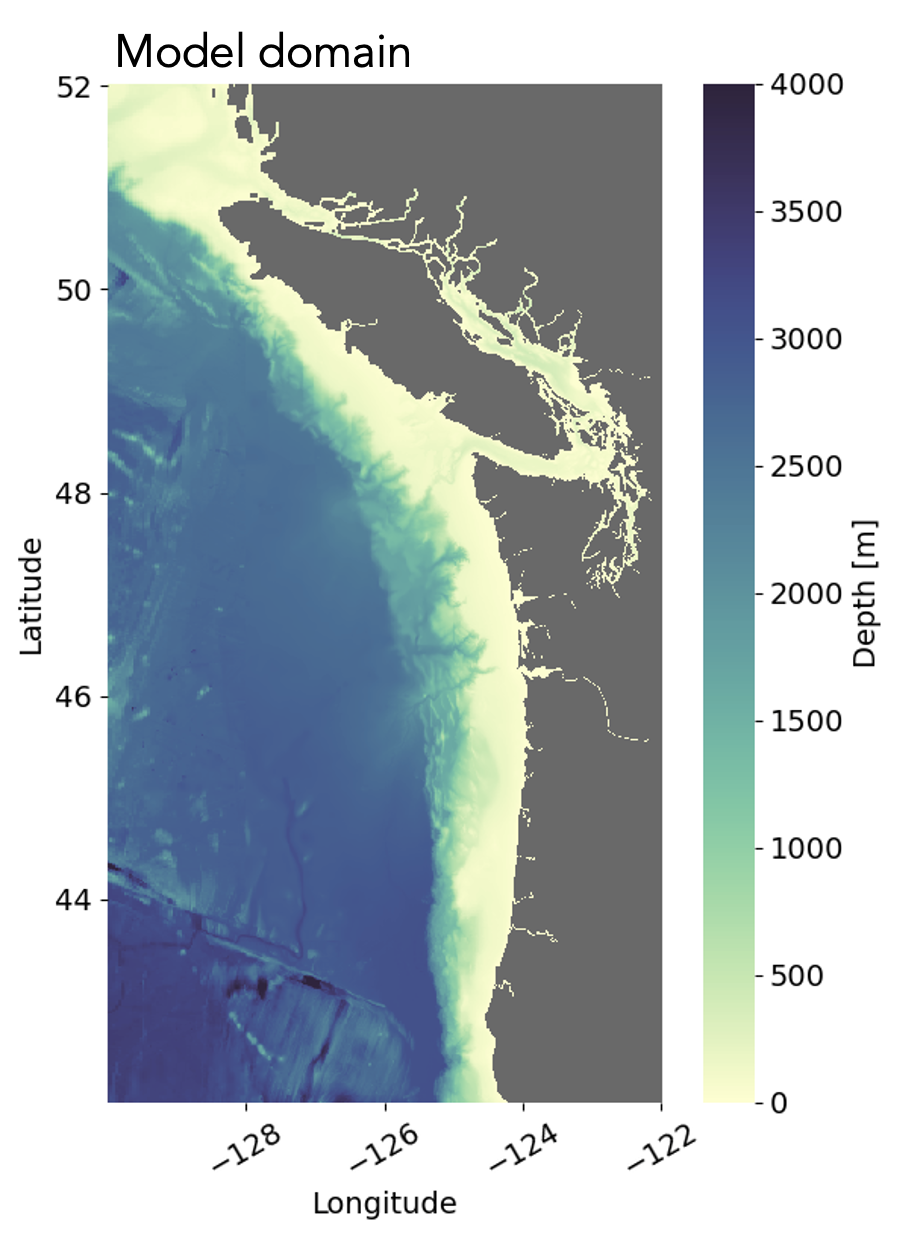
What is the LiveOcean model? LiveOcean is a regional model of the Salish Sea and nearby US and Canadian coastal regions. It is run operationally to provide daily, three-day forecasts of ocean properties, such as currents, oxygen, acidification, temperature, etc.
See today’s forecast here!

LiveOcean is also used for research studies. In this case, we conduct a comparison of two simulations using LiveOcean:
No-loading Condition
- Zero NO3 and NH4 in all WWTP effluent
- Represents a “no WWTP loading” condition
Loading Condition
- Existing levels of NO3 and NH4 in WWTP effluent
- Represents present-day conditions
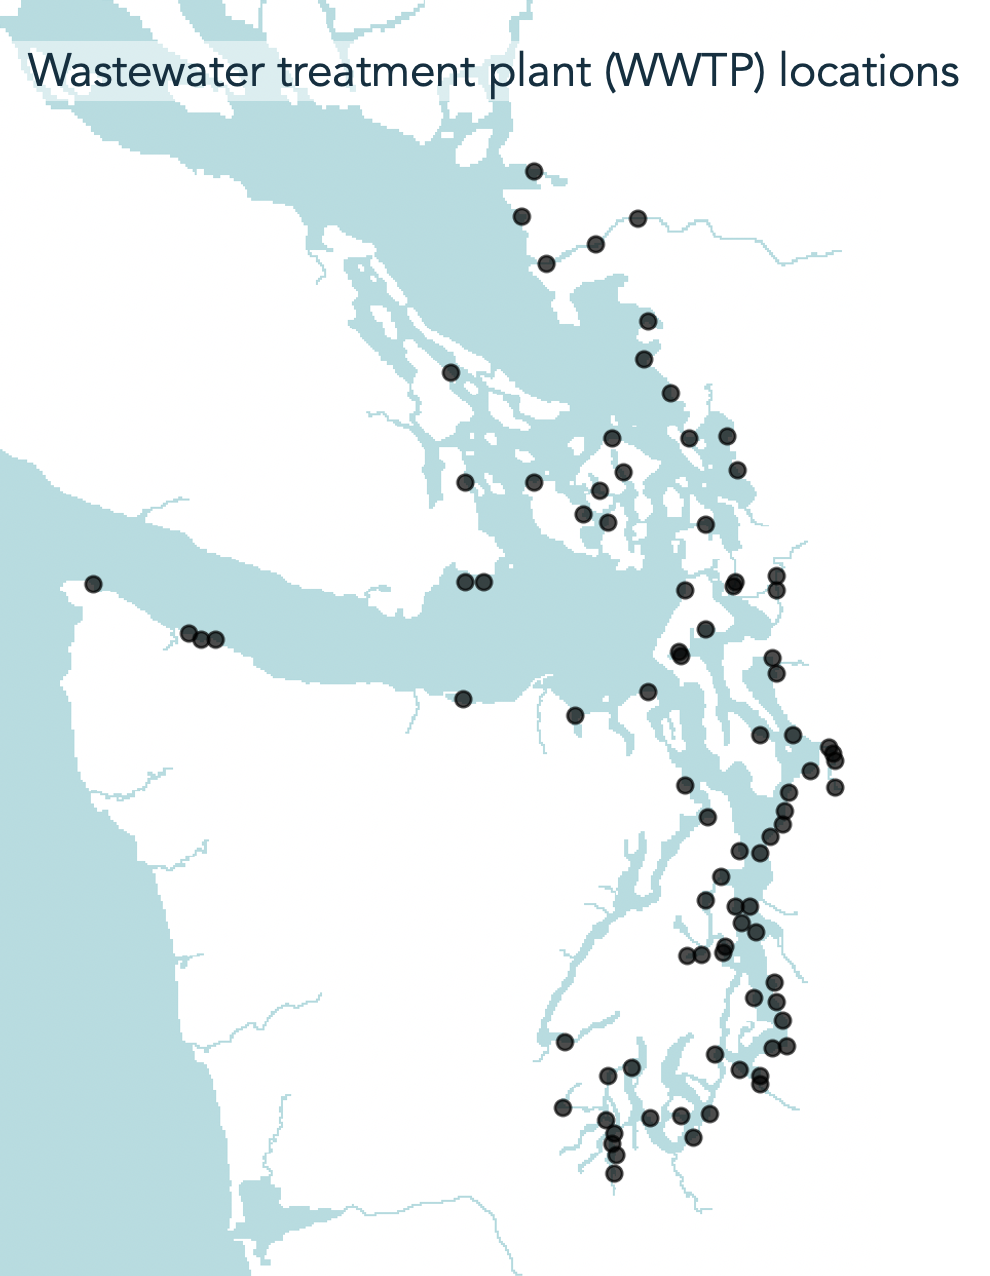
How do WWTPs change the system?
When we turn on WWTPs, we are:
- increasing the total nutrients in Puget Sound
- altering the composition of nutrients
1. Increasing total nutrients
Turning on WWTPs increased the total nitrogen in Puget Sound by 7.5%.
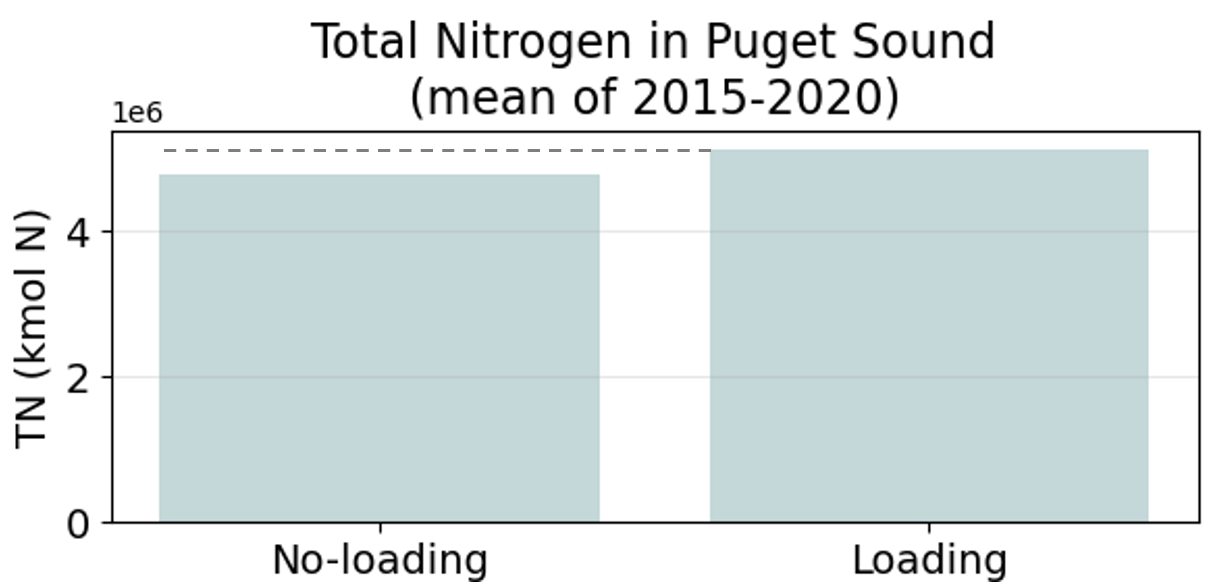
The total change in nitrogen is relatively small becasue WWTPs contribute a small fraction of nutrients relative to ocean inputs!
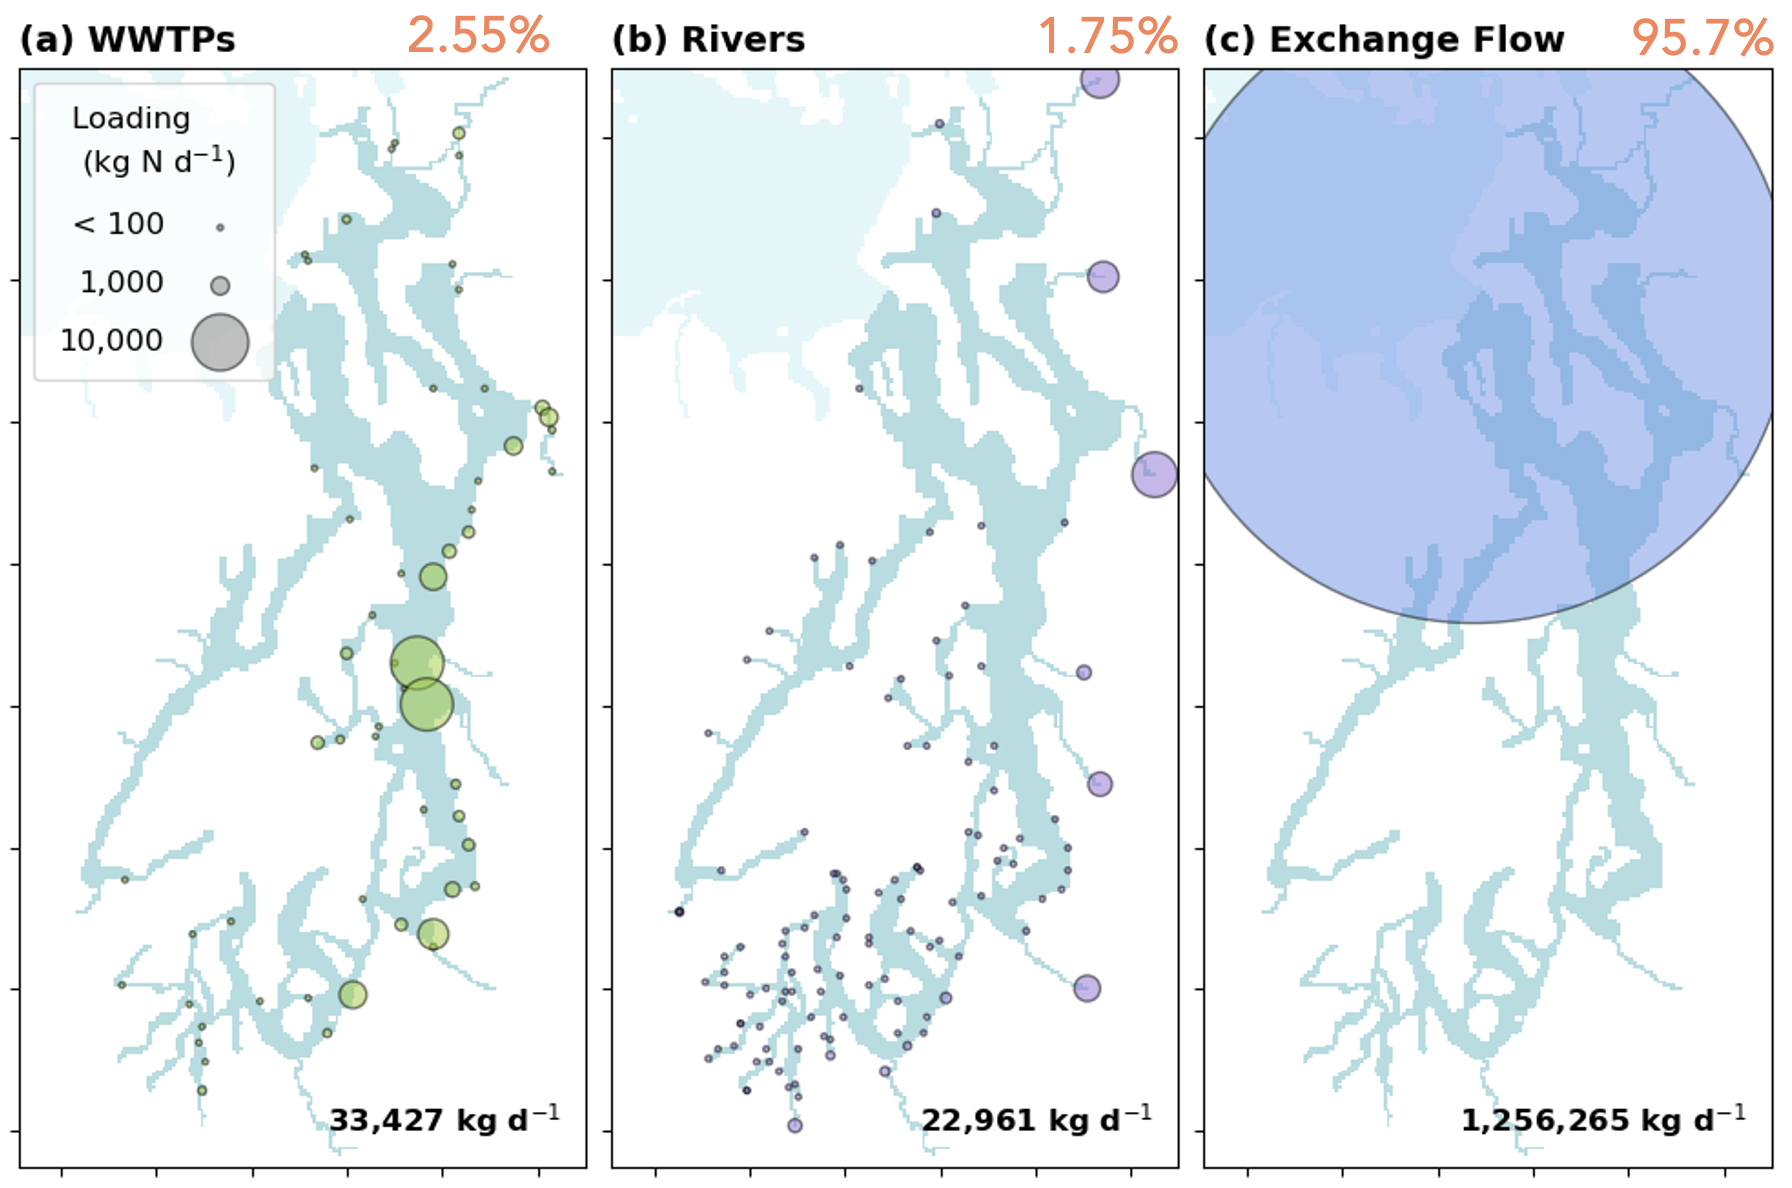
2. Altering nutrient composition
Naturally, there is much more NO3 than NH4 in Puget Sound. Rivers, for example, contribute primarily NO3.
In contrast, WWTPs contribute mostly NH4.
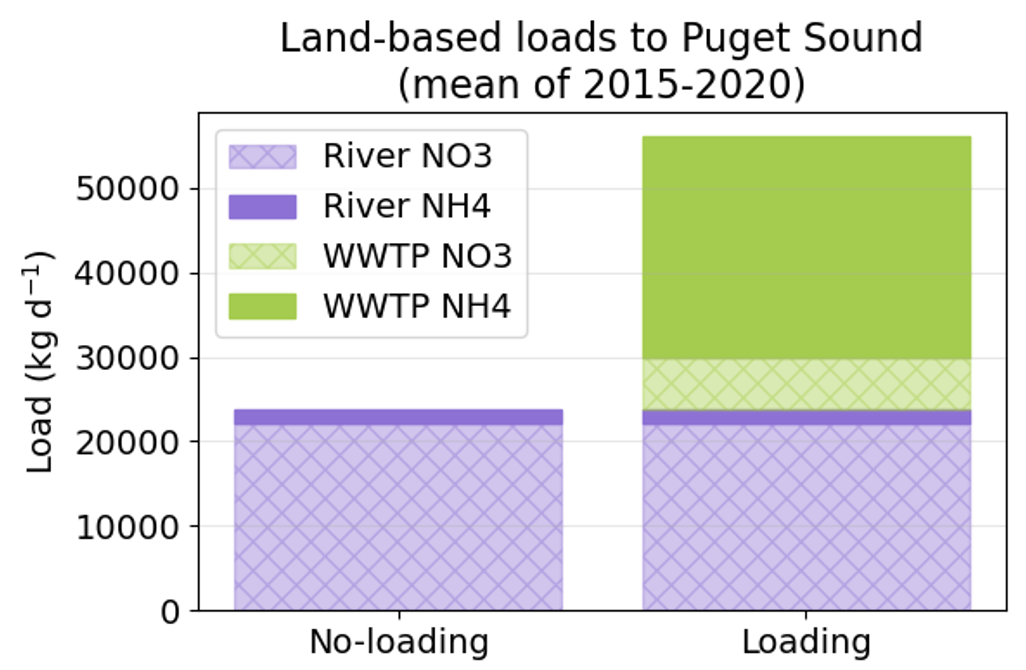
Maybe a pie chart of NO3 and NH4 composition in Puget Sound vs. WWTP effluent would be more ingsightful?
How do WWTP nutrients impact DO?
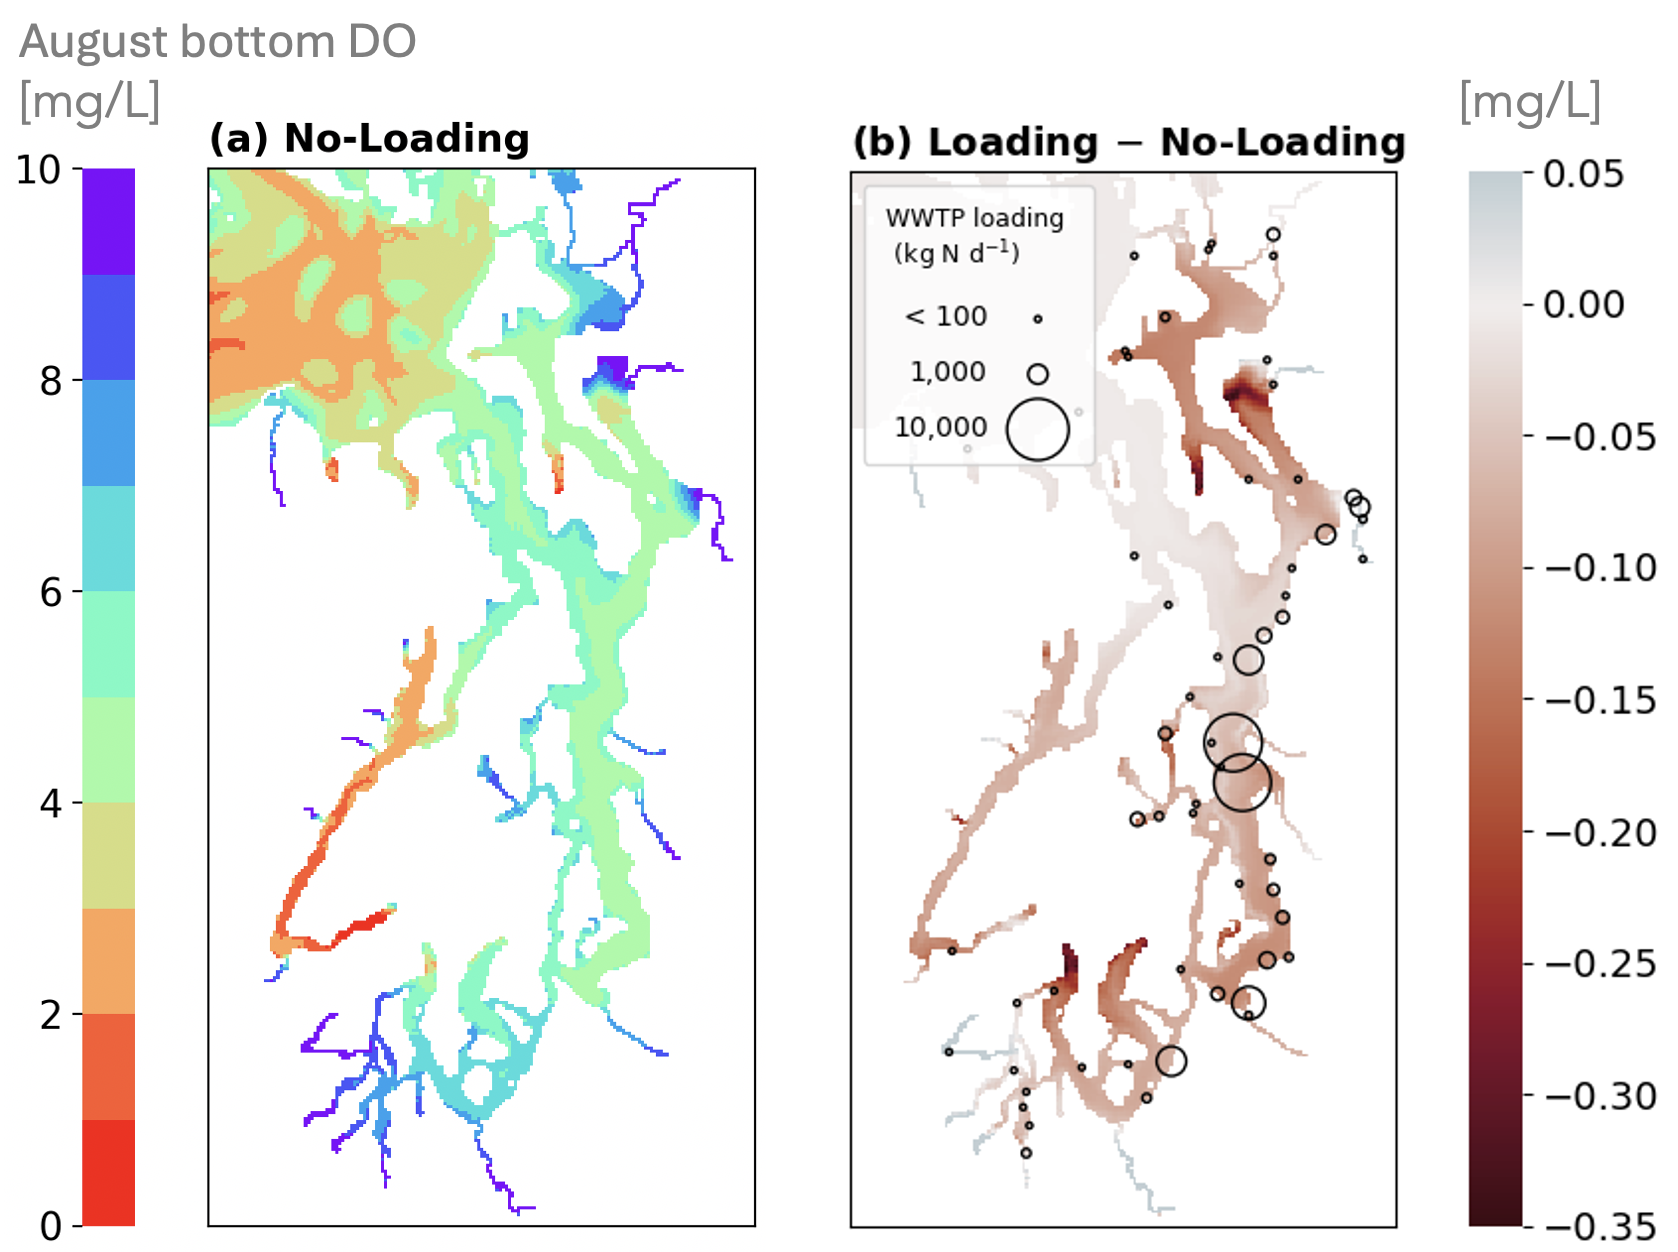
During August, bottom DO is lower by an average of 0.068 mg/L due to WWTPs.
Mean amount of DO (2015-2020) for depths deeper than 10 m decreased by 0.9%
Pathways for change
- Fertilizing blooms, leading to more DO consumption at depth
- Suppression of spring bloom –> timing shift
- Increased nitrification (i.e., oxygen consumed to convert NH4 to NO3)
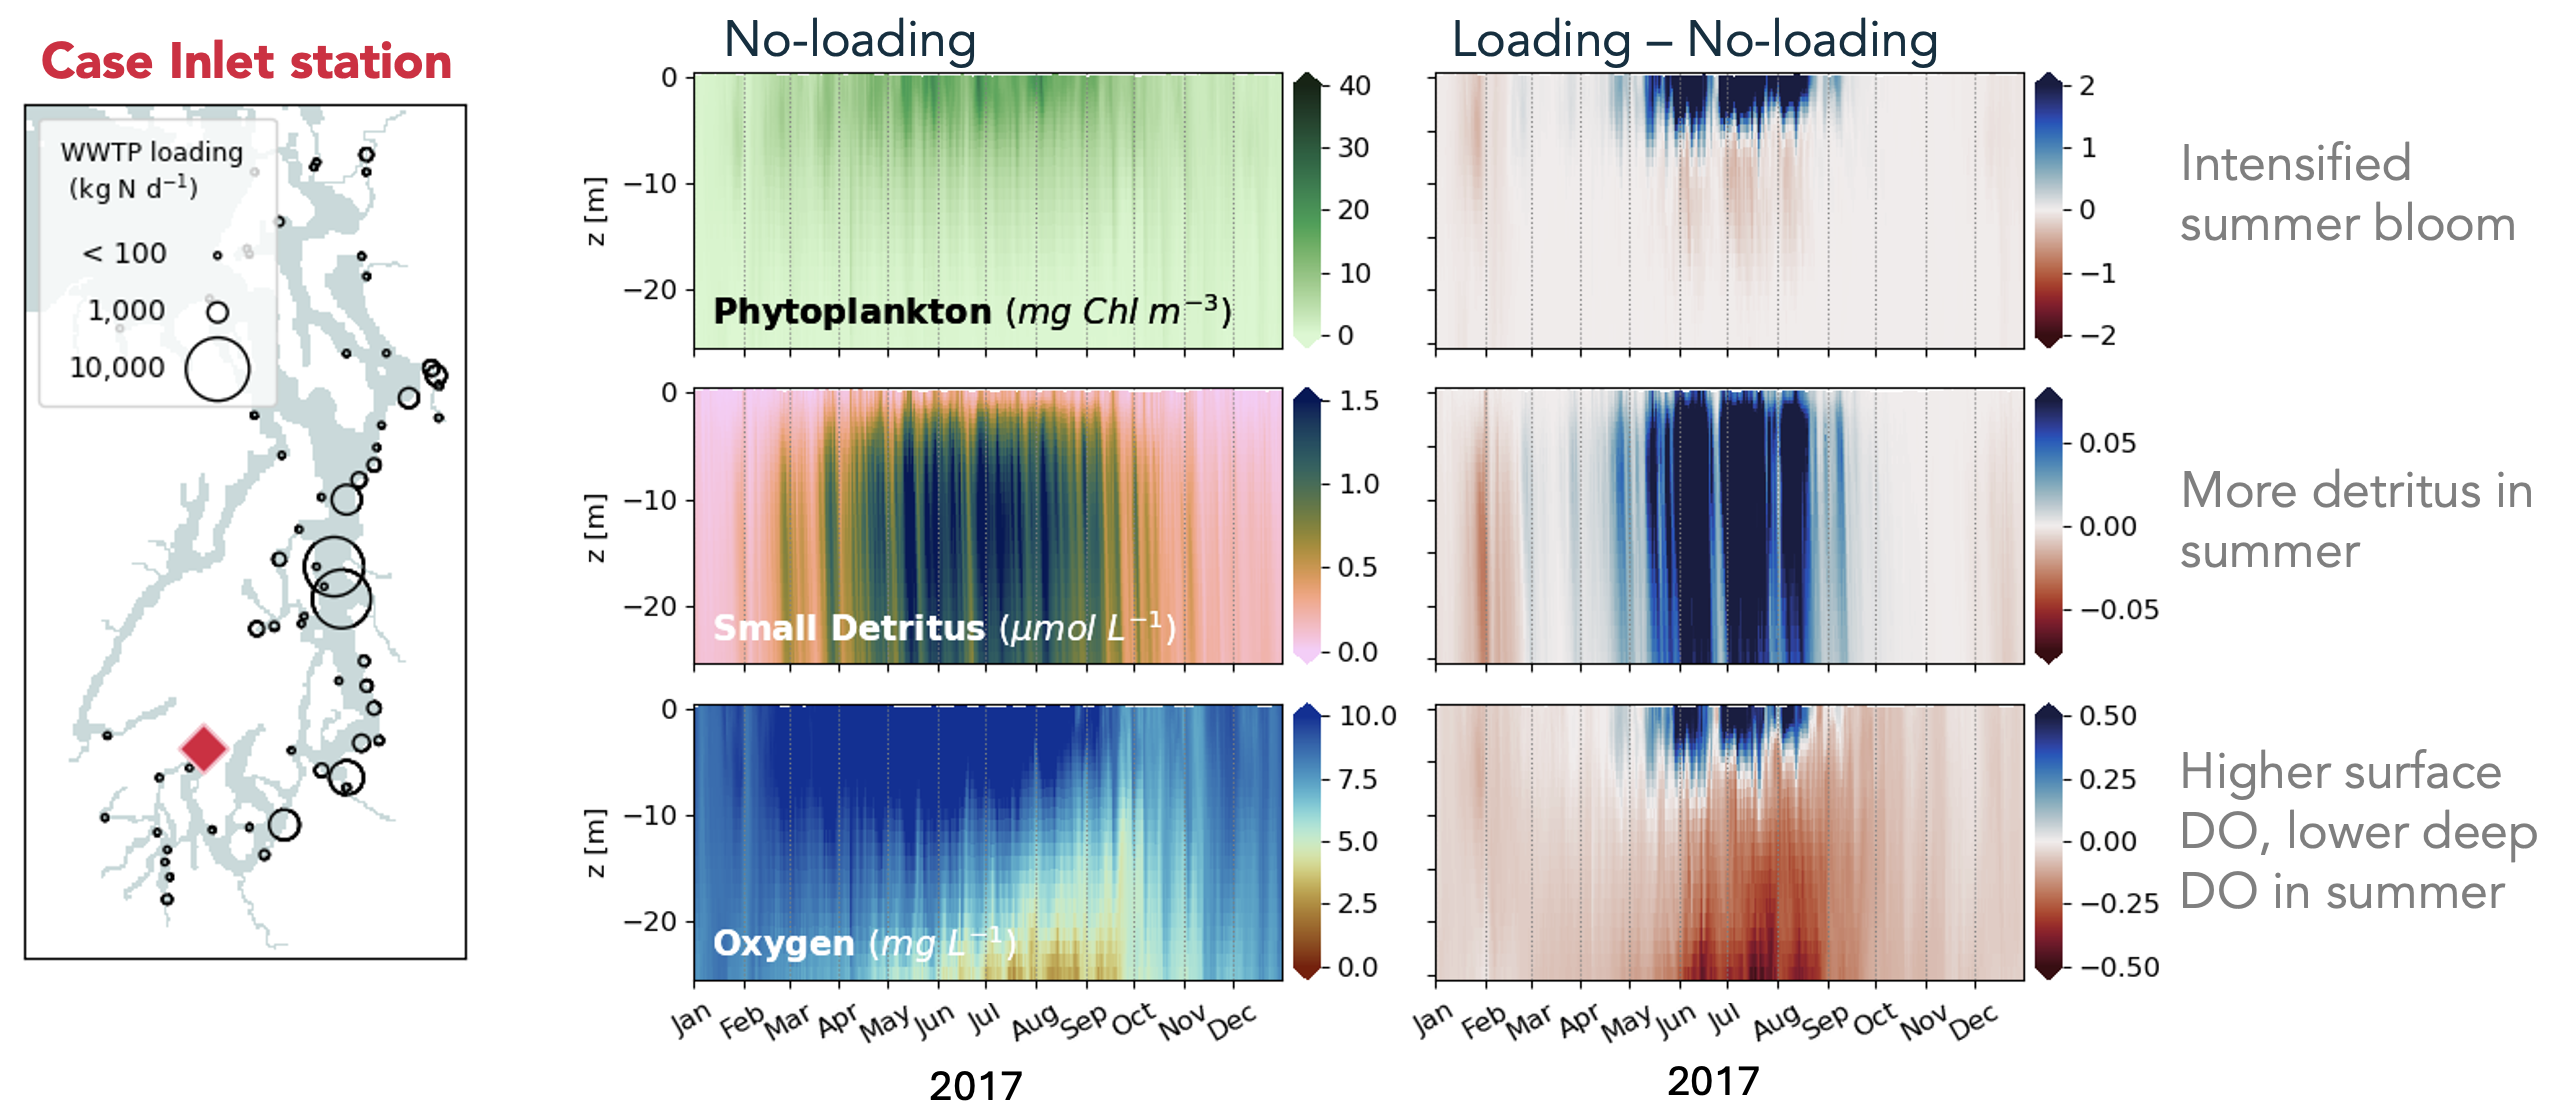
1. Fertilizing blooms
In some locations, like Case Inlet, WWTPs might increase the intensity of phytoplankton blooms, leading to lower bottom DO.
2. Suppression of spring bloom
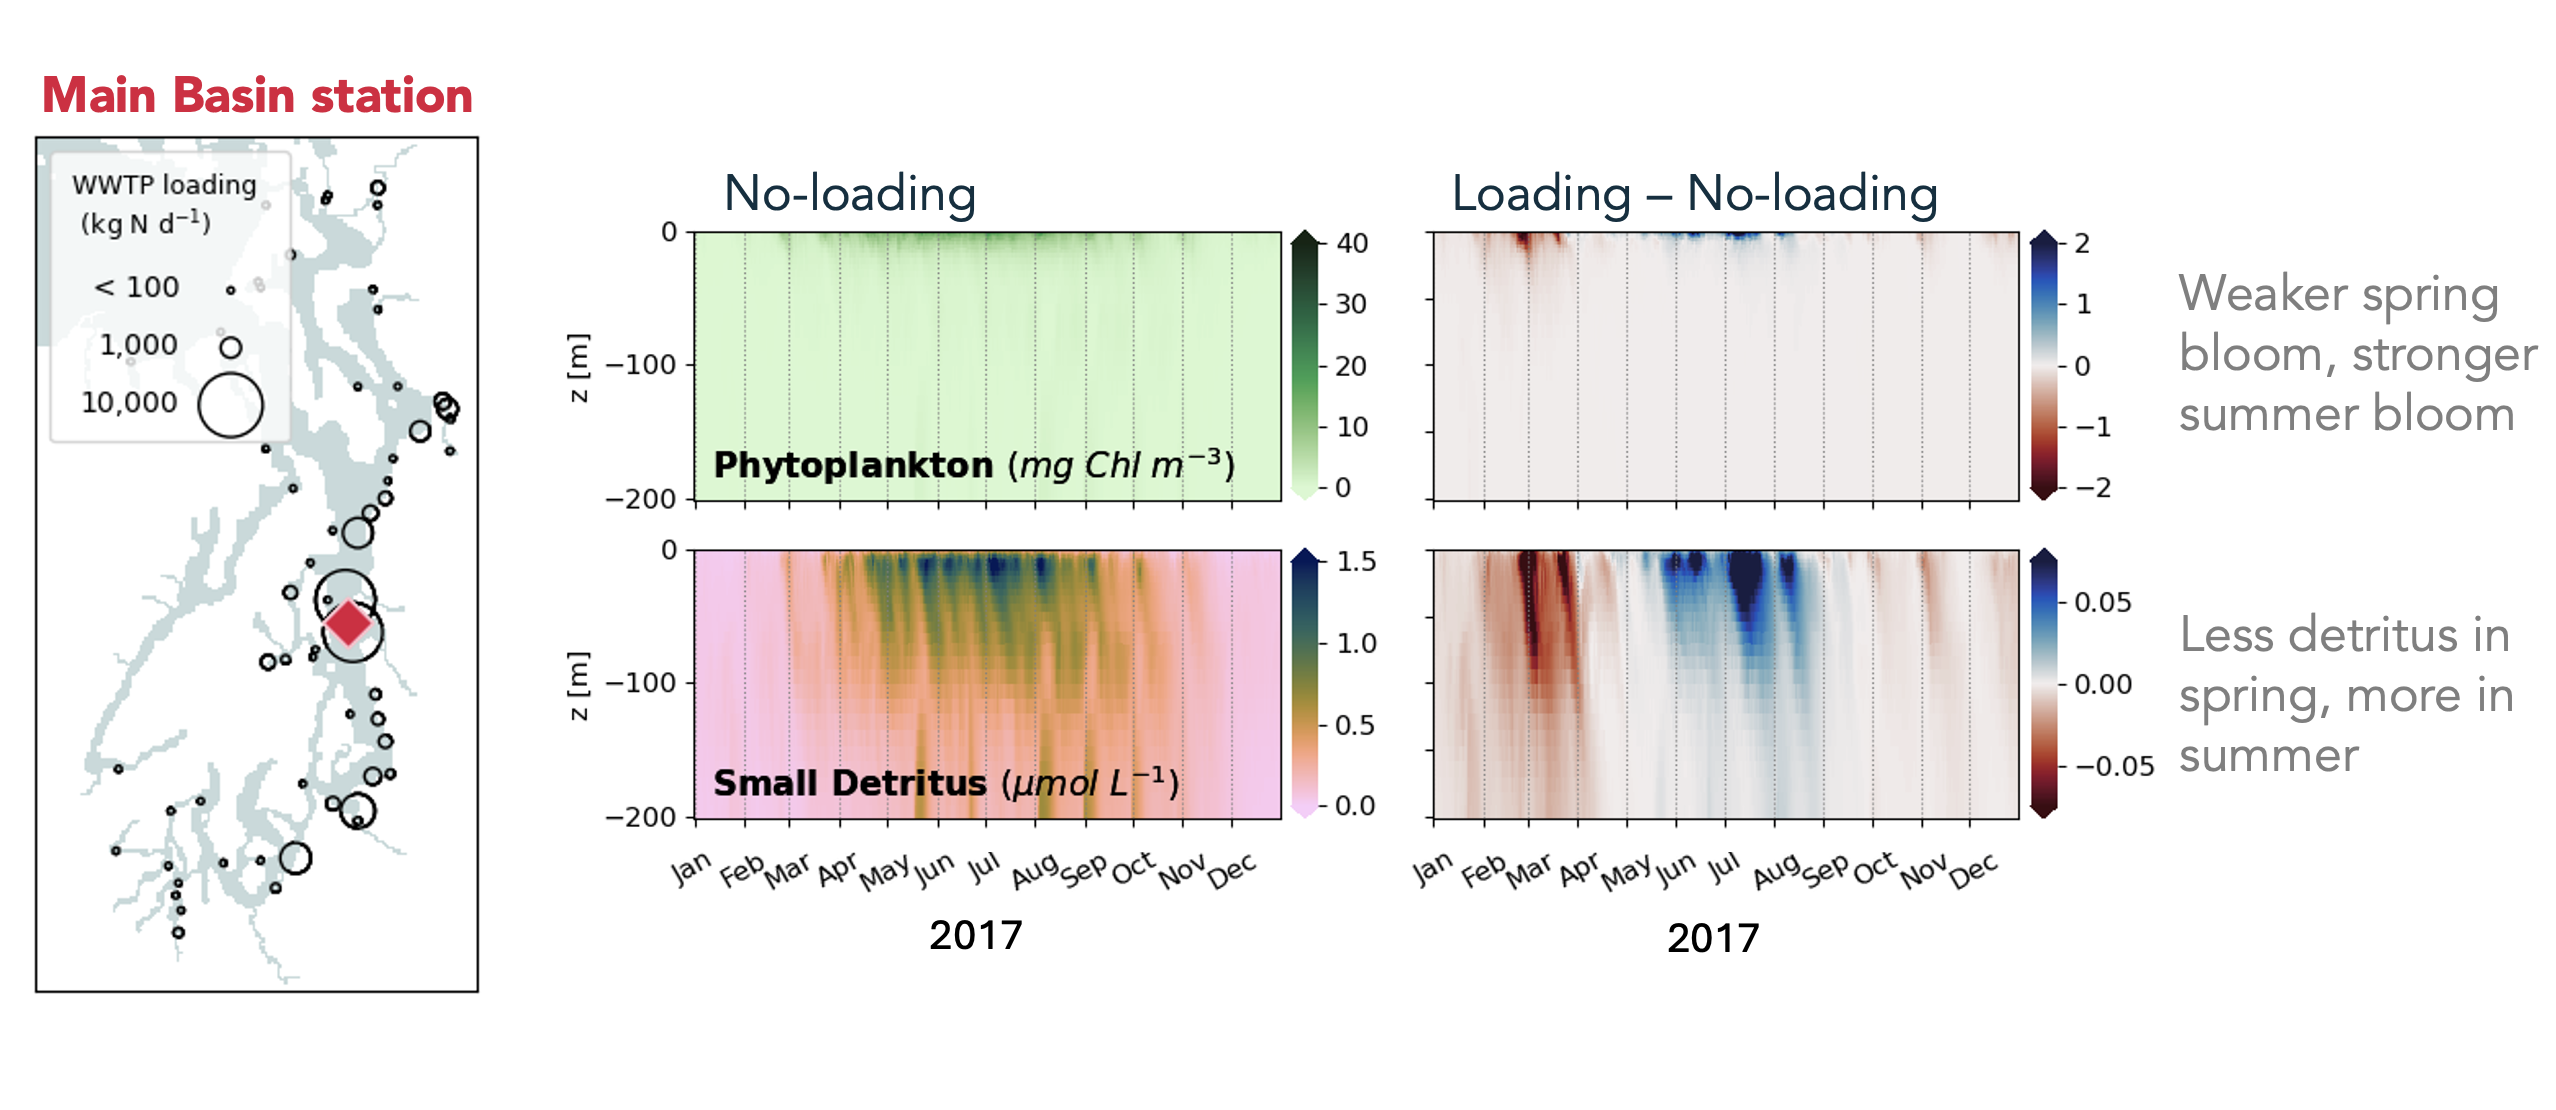
In other locations, like central Main Basin, higher NH4 concentrations might suppress phytoplankton growth.
3. Increase nitrification
Near the large WWTPs in Main Basin, oxygen may also be consumed through the conversion of NH4 to NO3.
\[𝑁𝐻_4^++2𝑂_2→𝑁𝑂_3^−+𝐻^++𝐻_2 𝑂\]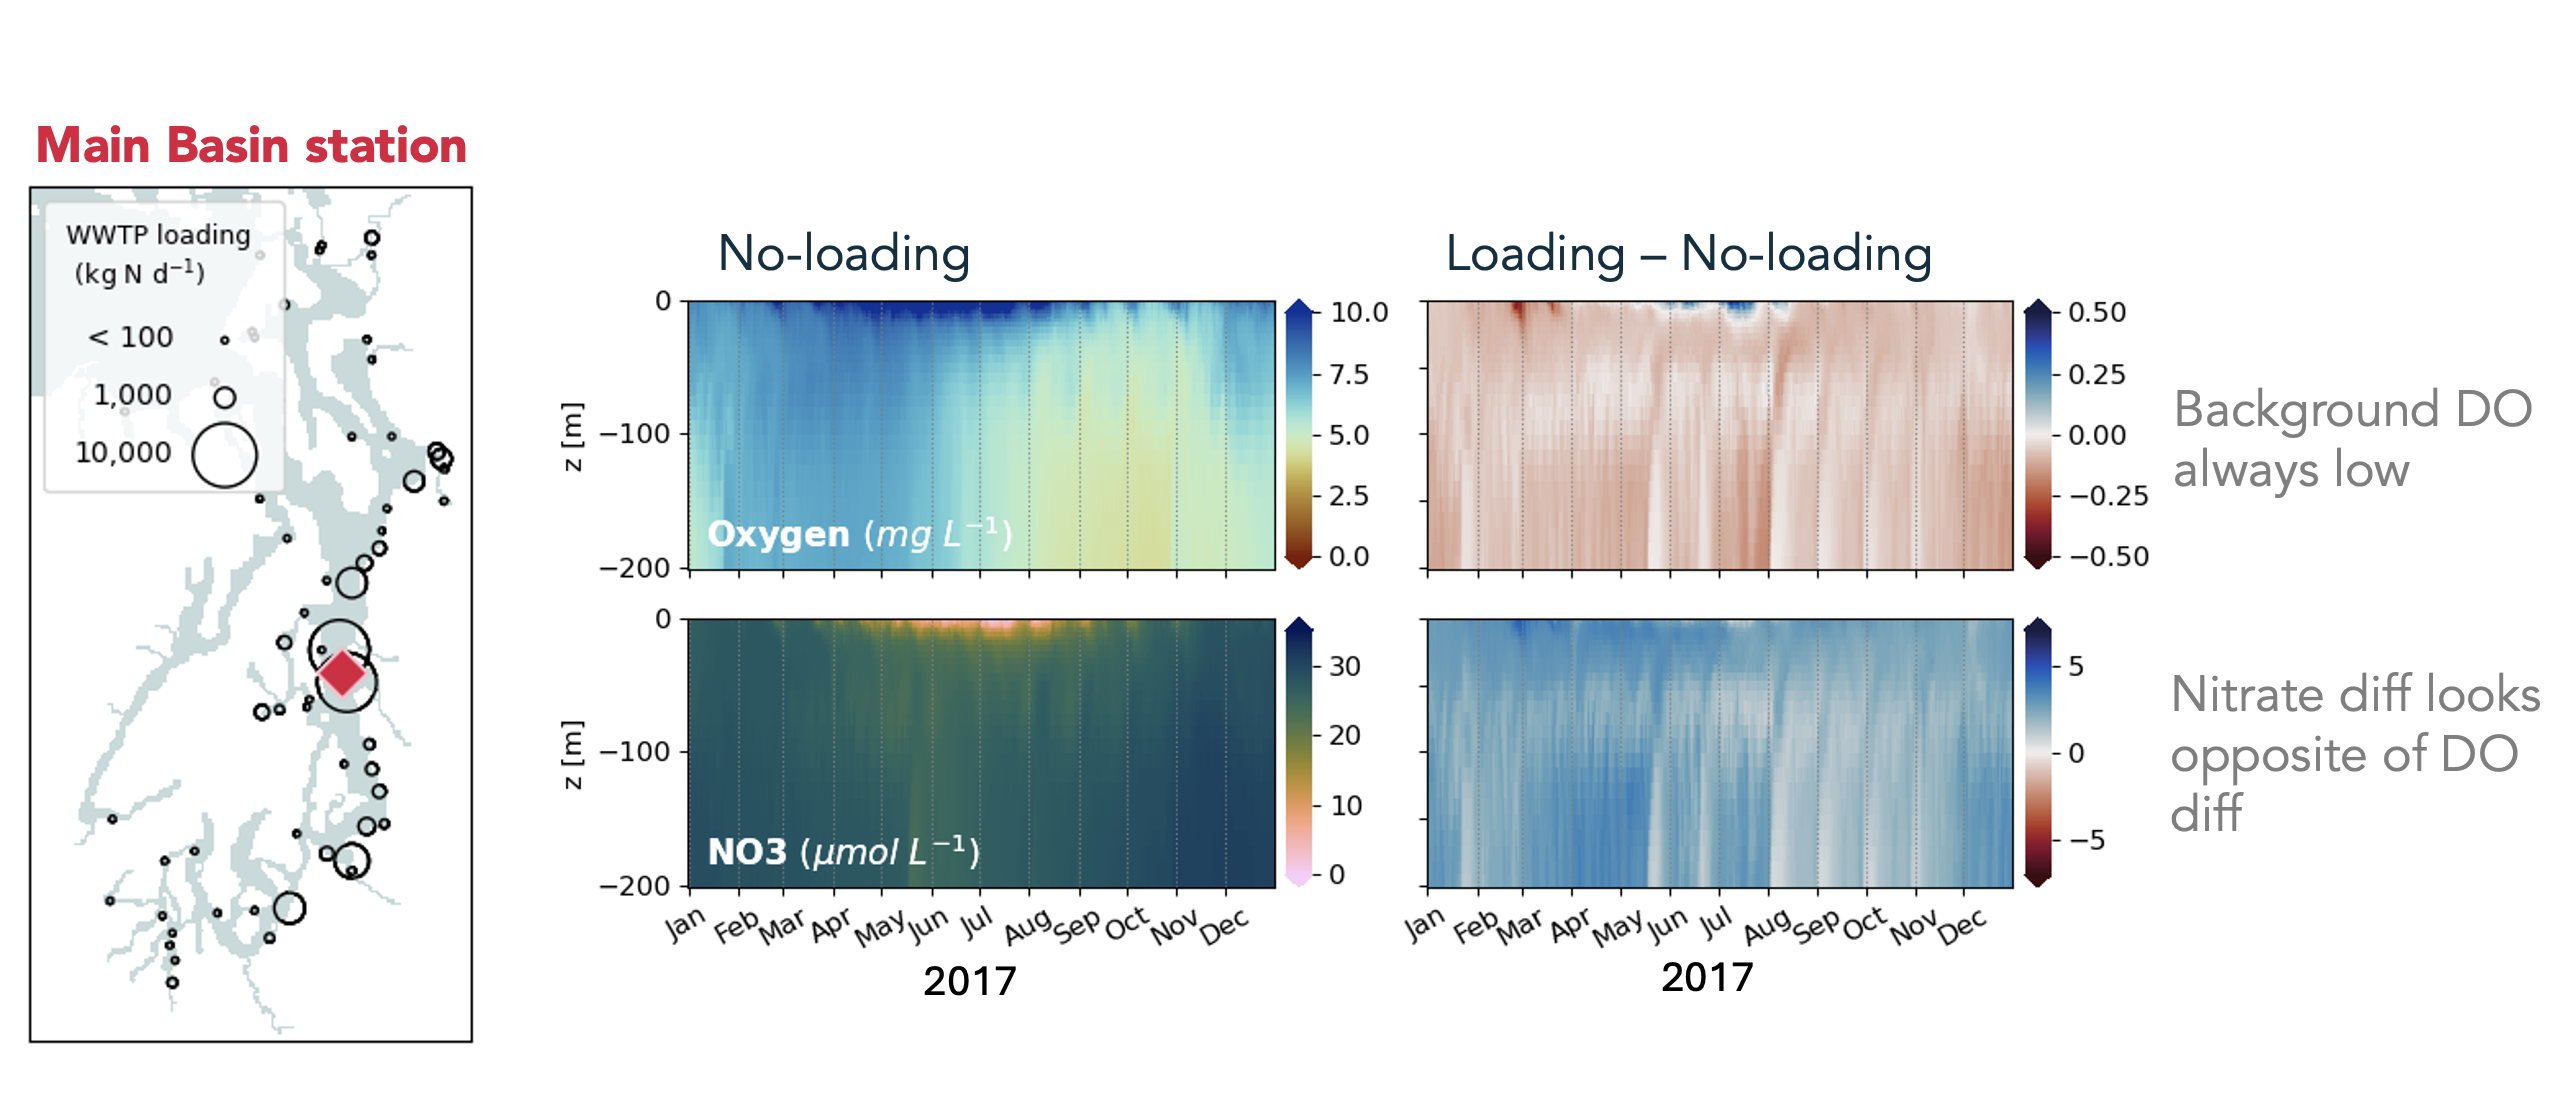
Key takeaways
- WWTPs add a small fraction of nutrients to Puget Sound because the ocean is naturally a massive source of nutrients
- WWTPs results in a small decrease in DO
- Pathways of change may be related to added nutrients that fertilize blooms, and also composition of nutrients that change biogeochemical cycling– these are still avenues of investigation
Important caveat
Physical processes are important, too! Especially ones that control where WWTP nutrients go, where blooms occur, and where there is strong flushing. Continued work will evaluate how physical processes shape the impact of WWTPs across Puget Sound.